Download
1 / 23
230 likes | 339 Views
Evaluating the Effectiveness of the Cure Violence Model in New York City. Jeffrey Butts, Director Research & Evaluation Center John Jay College of Criminal Justice City University of New York November 2014.

E N D
Evaluating the Effectiveness of the Cure Violence Model in New York City Jeffrey Butts, Director Research & Evaluation Center John Jay College of Criminal Justice City University of New York November 2014
“Cure Violence utilizes a public health approach. It considers gun violence to be analogous to a communicable disease that passes from person to person when left untreated. According to the logic of Cure Violence, gun violence is most effectively reduced by changing the behavior of individuals at risk to participate in gun violence and “denormalizing” violence by working to change the community norms that support and perpetuate gun violence.” — From the Summary, “Denormalizing Violence”
“The key question is whether the Cure Violence model’s simpler and potentially cheaper approach to violence reduction can operate alongside the more established focused deterrence model. The Cure Violence model is appealing in theory, but does it work in practice in a policy environment that is likely to be less welcoming and less supportive of any program whose employees are former offenders and gang members? Can the Cure Violence model co-exist with programs that are closely tied to law enforcement?” — page 14, “Denormalizing Violence”
“Without the inclusion of former offenders and formerly incarcerated persons as staff, the Cure Violence strategy would likely not be as effective. Violence interrupters and outreach workers interact with social networks of high-risk offenders and they are able to obtain information that would be unreachable by conventional entities, such as law enforcement authorities and social service agencies. This feature, however, is a serious obstacle for evaluation.” — page 15, “Denormalizing Violence”
“At its heart, Cure Violence is a community-based violence intervention—but part of its theory of change is focused on changing the behavior of high-risk individuals. … [M]any questions [are] unanswered… Is violence affected at the community level because a large number of individuals were directly influenced by the program to stop shooting, or were community residents in general affected by hearing or seeing the program’s message? Or perhaps the primary causal pathway to the larger community is from individual participants who then influence their immediate social networks. Evaluation research needs to identify and test these hypotheses.” — page 17, “Denormalizing Violence”
THREE DATA STRATEGIES IN THE EVALUATION OF “CURE VIOLENCE” Question: Were the Cure Violence programs implemented well, with fidelity? Question: Do young men in areas with Cure Violence programs adopt stronger anti-violence norms than do young men from similar areas without Cure Violence programs? PROGRAM OBSERVATION RESIDENT SURVEYS Central research question: Is the presence of a Cure Violence program in a community related to the strength of anti-violence social norms expressed by residents of the community or to the incidence of actual violence in the community? POLICE & HOSPITAL DATA Question: Do violent crime and violent injury trends in areas with Cure Violence programs improve over time more than they do in similar areas without Cure Violence programs?
THREE DATA STRATEGIES IN THE EVALUATION OF “CURE VIOLENCE” PROGRAM OBSERVATION RESIDENT SURVEYS Central research question: Is the presence of a Cure Violence program in a community related to the strength of anti-violence social norms expressed by residents of the community or to the incidence of actual violence in the community? POLICE & HOSPITAL DATA
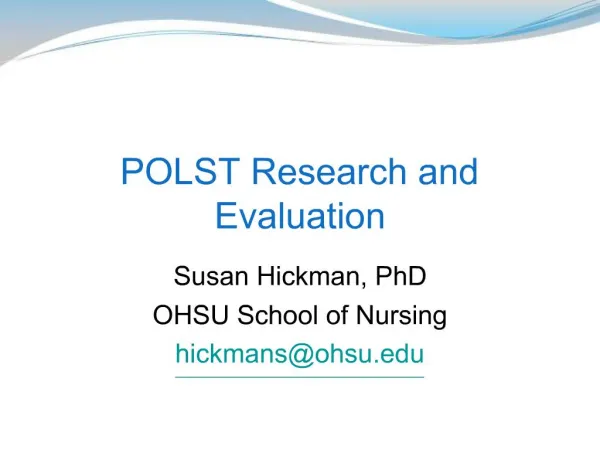
THREE DATA STRATEGIES IN THE EVALUATION OF “CURE VIOLENCE” Resident Surveys: Brooklyn and the Bronx 3 “Matching” Neighborhoods in Each Borough Cure Violence Area (N=200) Comparison Area 1 (N=200) Comparison Area 2 (N=200) Same Survey Method in All 3 Areas In-depth surveys of attitudes and norms about violence… among 18-30 year-old men, repeated 3 times to detect change. 2014 2015 2016
THREE DATA STRATEGIES IN THE EVALUATION OF “CURE VIOLENCE” Survey Approach • About 20 minutes of questions. • All questions administered via tablet (iPad). • Questions Focus on: • Personal experiences with violence • Attitudes toward the use of violence • Confidence in public institutions • Perceptions of personal safety • Collective efficacy • Knowledge of violence reduction programs • Contact with violence reduction initiatives
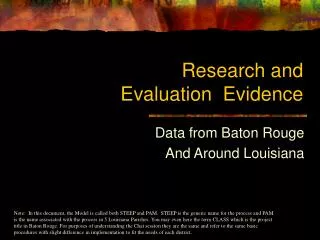
THREE DATA STRATEGIES IN THE EVALUATION OF “CURE VIOLENCE” PROGRAM OBSERVATION RESIDENT SURVEYS Central research question: Is the presence of a Cure Violence program in a community related to the strength of anti-violence social norms expressed by residents of the community or to the incidence of actual violence in the community? POLICE & HOSPITAL DATA Some of the survey crew All interviews conducted in the open in selected neighborhoods.
THREE DATA STRATEGIES IN THE EVALUATION OF “CURE VIOLENCE” PROGRAM OBSERVATION RESIDENT SURVEYS Central research question: Is the presence of a Cure Violence program in a community related to the strength of anti-violence social norms expressed by residents of the community or to the incidence of actual violence in the community? POLICE & HOSPITAL DATA
THREE DATA STRATEGIES IN THE EVALUATION OF “CURE VIOLENCE” DATA SOURCE: Site visits, staff interviews, and review of documents and program records in Cure Violence programs operated by agencies across New York City. Data gathered through these methods to be used to assess the quality and intensity of Cure Violence programs implemented in two demonstration areas in New York City relative to other neighborhoods and other cities. DATA SOURCE: In-person, structured surveys with 18-30 year-old male residents in six high-violence areas of New York City — two areas with new Cure Violence programs and four areas without Cure Violence programs. Each neighborhood sample includes approximately 200 subjects who are asked about their experiences, attitudes, and norms related to interpersonal violence. Each neighborhood to be surveyed three times over 24 months to detect any changes in norms and attitudes. Everything measured at the level of census tract PROGRAM OBSERVATION RESIDENT SURVEYS Central research question: Is the presence of a Cure Violence program in a community related to the strength of anti-violence social norms expressed by residents of the community or to the incidence of actual violence in the community? POLICE & HOSPITAL DATA DATA SOURCE:Violence indicators for all New York City neighborhoods, including: 1) police data since 2003 on all violent crimes reported to NYPD, geocoded to the census tract in which the crime occurred; and2) hospital data since 1995 about all patients appearing at emergency rooms with injuries due to violence, geocoded to the census tract of the patient’s home address.
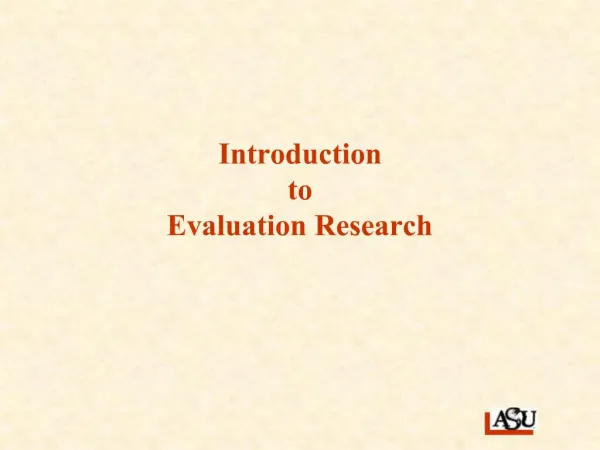
■ About 2,200 census tracts in all five boroughs of NYC ■ Each census tract typically has 2,000 – 10,000 residents ■ Half of all tracts either have 0 shootings or too few residents to calculate rates ■ 198 census tracts (9%) account for half of all shootings across all 5 NYC boroughs ■ We are analyzing violence trends in about 1,000 census tracts
Cure Violence Catchment Areas Typically Affecting 4-6 Census Tracts
HOSPITAL-REPORTED VIOLENT INJURIES BY PATIENT HOME ADDRESS: 1995-CURRENT POLICE-REPORTED VIOLENT CRIMES BY LOCATION OF INCIDENT: 2003-CURRENT DEMOGRAPHICS, EMPLOYMENT, POVERTY: 2000 & 2010 For every census tract, we have 3 sources of data
DATA ANALYSIS PLAN So, every census tract can be categorized by: The presence and/or duration of violence reduction programming. e.g. 0 = at least 2 tracts away from a program area 1 = adjacent to, or 1 tract away from a program area 2 = tract is actually in a program catchment area e.g. 0 = never even adjacent to a program area 1 = in, or adjacent to a program area less 2 years ago 2 = in, or adjacent to program more than 2 years ago
DATA ANALYSIS PLAN Tracts can also be ranked relative to all other tracts: Our analysis will compare each census tract by how it ranks citywide before and after program operation e.g. shooting rate 2003-2015 violent crime rate 2003-2015 rate of increase in crime 2003-2015 rate of E.R. admissions for violent injuries 1995-2015 rate of increase in E.R. admissions 1995-2015 Say this was census tract “20742” and it ranked as the 20th most violent tract in 2014, but by 2016 it had dropped to 30thmost violent, or 40th, or 100th? What would this mean?
DATA ANALYSIS PLAN 2014 2015 2016 2017 . . . 20th 21st 22nd 23rd 24th 25th 26th 27th 28th 29th 30th . . . _____________________________________________________________ _____________________________________________________________ _____________________________________________________________ _____________________________________________________________ _____________________________________________________________ _____________________________________________________________ _____________________________________________________________ _____________________________________________________________ _____________________________________________________________ _____________________________________________________________ _____________________________________________________________ 65033 75020 98731 58001 40744 20742 46984 94852 32919 13075 45983 46984 94852 32919 13075 45983 65033 75020 98731 40744 20742 58001 40744 20742 46984 94852 32919 13075 45983 65033 75020 98731 58001 94852 32919 40744 20742 46984 13075 45983 65033 75020 98731 58001 If we establish the amount of change in ranking that would be expected by chance alone, we can establish the statistical significance of the actual change in one census track relative to all other census tracts, and then perhaps infer a program effect.
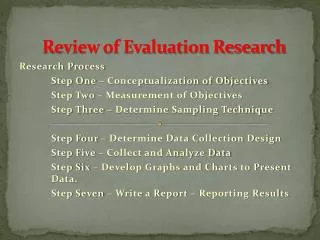
Data/Analysis Plan Research Questions Summarizing…
Data/Analysis Plan Research Questions Were the programs done right? Site visits, staff interviews, and review of documents and program records in Cure Violence programs across New York City. Data gathered through these methods are being used to assess the quality and intensity of Cure Violence programs implemented in Brooklyn and the Bronx, compared with other sites in New York City and other U.S. cities.
Data/Analysis Plan Research Questions Were the programs done right? Conducting in-person, structured surveys with young male residents of six high-violence areas of New York City — two areas with and four without Cure Violence programs. Each sample includes approximately 200 subjects who are asked about experiences, attitudes, and norms related to interpersonal violence. Each neighborhood is surveyed three times over 24 months to detect changes in norms and attitudes about violence. Can we detect changes in the anti-violence attitudes of 18-30 year-old men in high-risk neighborhoods?
Data/Analysis Plan Research Questions Were the programs done right? Compiling indicators of violence and violent injuries for all New York City neighborhoods using: 1) police data since 2003 on allviolent crimes reported toNYPD, geocoded in the censustract in which the crimeoccurred; and2) hospital data since 1995 about all patients appearing at emergency rooms with injuries due to violence, geocoded in the census tract of patient’s home address. Can we detect changes in the anti-violence attitudes of 18-30 year-old men in high-risk neighborhoods? Can we measure improvement in violent crime and violent injuries at the census-tract level across New York City.
The Research & Evaluation Center’s Study of Cure Violence in New York City is funded by the New York City Council and by the Robert Wood Johnson Foundation of Princeton, NJ Keep Up with Study Developments: http://JohnJayREC.nyc