Download
1 / 30
300 likes | 321 Views
UNIVERSITY OF NIGERIA, NSUKKA SCHOOL OF POST GRADUATE STUDIES. ICT AND DATA ANALYSIS PROF. THOMAS M. OKONKWO Department of Food Science and Technology E-mail: thomas.Okonkwo@unn.edu.ng Phone: +234806657609. GOALS AND OBJECTIVES At the end of the workshop the participants should be able to :.

E N D
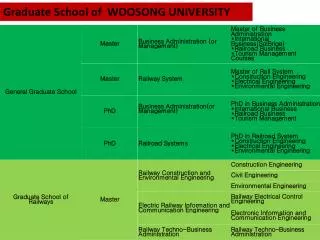
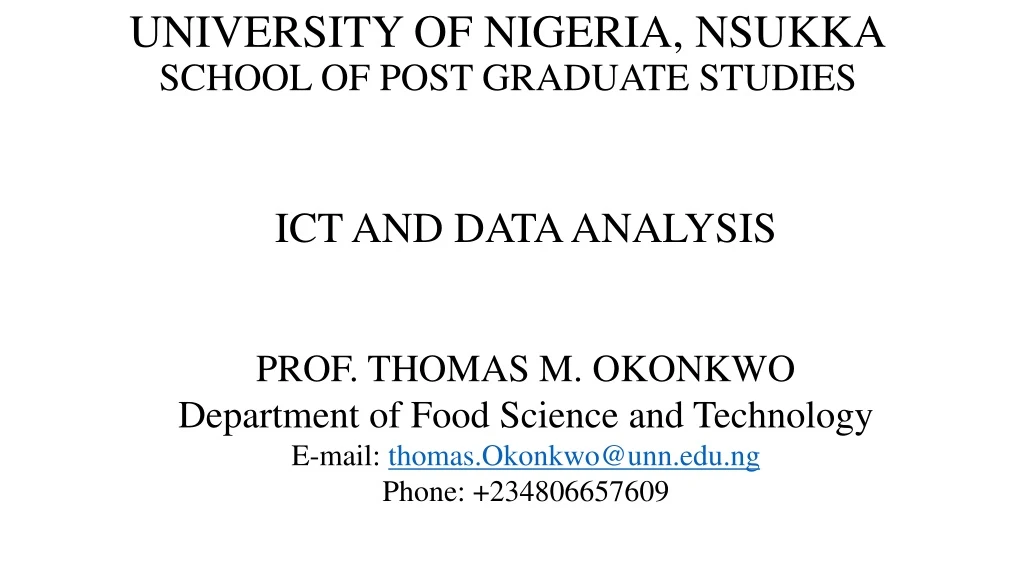
UNIVERSITY OF NIGERIA, NSUKKASCHOOL OF POST GRADUATE STUDIES ICT AND DATA ANALYSIS PROF. THOMAS M. OKONKWO Department of Food Science and Technology E-mail: thomas.Okonkwo@unn.edu.ng Phone: +234806657609
GOALS AND OBJECTIVESAt the end of the workshop the participants should be able to : • Define ICT • Appreciate uses of ICT • Define data • Appreciate sources of data • Understand the meaning and importance of data analysis • Understand ICT tools applied in data analysis • Appreciate basic concepts of SPSS • Use SPSS to analyse some data • Interpret such analysed data
INTRODUCTIONICT and Data Analysis for life sciences • Purpose: provide a feel for computerized statistics for those in life sciences who do not understand or feel comfortable with tedious calculations involved in pure statistics • Agriculture, Pharmacy, Biological sciences and Veterinary sciences • Especially with students who are working in their projects • Many statistical books carry equations, which although will satisfy statistical concerns, but will discourage non-statistical & non-mathematical specialists • Many books are available but not adequate for modern day digital age • First part of this presentation deals with background on ICT & data analysis, 2nd part on software used in data analysis & 3rd part on use of SPSS to analyse data
ICTWHAT IS ICT? • Information Communication Technology • Extensional term that stresses the role of unified communication and integration of Telecommunication with computers • Refers to convergence of audiovisual telephone networks with computer networks through a single cabling or link • Umbrella term that includes any communication device encompassing radio, television, cell phones, computer and network hardware, satellite system and also various services and applications with them • Covers any product that will store, retrieve, manipulate, transmit or receive information electronically • A broad subject whose concept is still evolving
ICT continues • Components that make up the term are Information, Communication and Technology • Information is regarded as an important source for all human activities, a product of human brain in action • Communication is a basic prerequisite of all human performance and interaction between two or more people in form of transmission of thoughts, information and commands by employing different infrastructure available • Technology is science of craft which is collection of techniques, skills, methods and processes used in production • Put together, ICT refers to technologies that provide access to information through telecommunication with or without applying software • There are three distinct strands in the development of information technology: technologies used to record and store data, technologies used to analyse data and technologies used to communicate data
DATA - • Facts or statistics for reference or analysis • Collection of numerical quantities for inference or analysis • Pieces of information output by a sensing organ or device • Sources of data include: Observations made through *physical measurements (length, weight, volume, etc) * counts (number of products that are wrinkled, rotten, damaged, too big, too small, scratched, etc) *Counts over time (seconds, minutes, hours, days, weeks, years, decade, etc) • The observations within the limits set are called data • Data may come from selected items called sample or it can come from the entire supply called population
TYPES OF DATA • QUALITATIVE DATA: Measurements that are not expressed in terms of numbers but by means of natural language description • QUANTITATIVE DATA: - Numerical measurements expressed in terms of numbers - not all numbers are continuous or measurable eg identity number, staff number, social security number, etc - always associated with measurement through a scale - could be discrete eg 1,2,3 men or continuous eg 5.5, 7.1, 8.9 cm • NOMINAL DATA: unordered categories such as gender, race, religion • ORDINAL DATA: -ordered categories eg small, medium, large, etc - Attitudes eg agree, disagree, neutral, et
COMMON TYPES OF DISTRIBUTION OF DATA • This is the position, arrangement or frequency of occurrence of data within the population • Analysis of data cannot logically proceed without understanding the type of distribution present • There are many types of distribution in which the data may be found: Normal distribution Binomial distribution Poisson distribution T-distribution F-distribution Exponential distribution Weibull distribution Chi-square distribution multinomial distribution Hypergeometric distribution etc • All these types of distribution comprise of methods concerned with analysis of subset data leading to predictions or conclusions of the population or entire set • Numerical data describing a characteristic of a population is called parameter while numerical data describing a characteristic of a sample is called statistic
DATA ANALYSIS • Definition - a process of applying statistics to organize, represent, describe, evaluate model and interpret data - a process of evaluating data using analytical and logical reasoning for the purpose of obtaining useful information • Importance • To provide an explanation to various concepts, theories, frameworks and methods used • Helps at arriving at conclusions and proving hypothesis • Helps in making useful and better decisions • Helps in improving the performance of an establishment or business or organization
DATA ANALYSIS PLANFor a successful data analysis, a plan should be put in place to: • Ensure that the questions and data analysis instruments give the required information • Align the expected report with results of analysis and interpretation • Improve reliability through consistent measures overtime • The key components of data analysis plan include: - the purpose of evaluation - what key questions should be asked or what key measurements to be taken - What analytical techniques should be developed or adopted - how would the data be presented and interpreted
ICT AND DATA ANALYSIS • This is the application of Information Communication Technology including its various software packages in collection, collation, analysis and interpretation of data • Several software are available for data analysis including: - SAS/STAT - MegaSTAT - JPM - MINITAB - S-Plus - STATISTICA - SPSS - MATHEMATICA - BNDP -E-View - Genstat • These software help to analyse data and plot graphs
SPSS • SPSS appears to be the most commonly used software by students and non-computer/non statistics professionals • SPSS is an acronym for Statistical Package for Social Sciences • It is an application software developed by IBM • It is not limited to Social Sciences but to other areas of learning • The newest version is 26.0 • The use of SPSS will be the focus of further discussion
STATISTICAL PACKAGE (SPSS) ORGANIZATION SECTIONS AND MODES: • There are two main sections: Input section and Output section • The Input Section: where data are defined and entered - there are two modes between which users can switch - ‘Variable view’ and ‘Data View” - users can switch between the modes by clicking on the tab on the bottom of the screen • The Output section: where results are displayed - opens a separate window where results are displayed - output data are saved as separate file to the dataset
VARIABLE VIEW • Contains cells known as Data entry and analysis Cells • These cells are setup by naming and defining the variables included • Variable names supplied by the operator must start with an alphabet • Variable choices with descriptions can be added using the ‘labels’ dialog box • Variables can be copied and pasted into other cells if they have similar format
DATA VIEW • Resembles a spreadsheet programme • Organised in rows and columns • Variables are organised as columns • Rows represent a singles ‘case’ in the dataset containing values for variables relating to that case • Often, codes are used to enter data • Where necessary, labels can be used to describe data • Using SPSS, the defined labels will appear by clicking the dropdown list arrow on the right side of the cell. Operator can select his/her choice
DATA ANALYSIS • After entering, data are crosschecked for typographical errors which may affect results • All analytical functions in SPSS can be accessed by using the Analyse menu • There could be other dialog boxes which allows the operator to use specific functions of the variable parameters • If such dialog boxes appear, they have to be filled to format the output
SPECIFIC ANALYTICAL CASES DESCRIPTIVE STATISTICS • Firstly, used to get a feel of the data, secondly, used in tests themselves and thirdly, used to indicate the error associated with results and graphical output • Has to do with a method of collecting and describing a set of data to provide information on that dataset (sample) • Does not draw inferences or conclusions about a larger set of data or population • Descriptive statistics commonly used include measures of central tendency and measures of dispersion
Measures of Central Tendency • These are exemplified by mean, median and mode • Mean : most popular measure of an average of a number of observations - Arithmetic mean: average of a set of data considering minus signs -Absolute mean: average of a set of data disregarding minus signs - Geometric mean: root of the sum of a number of observations - Harmonic mean: sum of the inverse of each observation divided by the number of observations • Mode: the value of the measurement which occurs most frequently • Median: the value of the middle item when the items are arranged according to size
Measures of Dispersion • These are exemplified by range, variance, standard deviation, standard error, coefficient of variation • Range: the difference between the maximum and minimum value • Variance: the mean square deviations of all individual values from the arithmetic mean • Standard deviation: most common and best measure of spread. It is the square root of variance • Standard error: assesses how closely the sample relates to the population • Coefficient of Variation: used to determine how much variation occurs within the data set or used to compare variation between data set
RELATIONSHIP BETWEEN VARIABLESCORRELATION AND REGRESSION CORRELATION: Deals with the estimation and test of significance of the correlation coefficient r • r measures degree of association between two variables, x and y • Computation of r is based on the amount of variability in one variable that can be explained by the function of the other variable • In all cases r lies between +1 and -1. Extreme values indicating perfect association. Values between 0 and ±1 indicate degrees of association • The square of r [r2] is known as the coefficient of determination and expresses the proportion of the total variation in the values of the dependent variable (Y) which can be explained by the linear relationship with the values of the independent variable (X) • Signs (+1 and -1 ) indicate the direction of change
REGRESSION: • Describes the effect of one or more variables X (designated as the independent variable) on another variable, Y (dependent variable) by expressing the later as a function of the former • It is important to clearly distinguish the dependent and independent variables. Generally the character of major importance becomes the dependent variable and the factor or character that influences it becomes the independent variable. • Establishes the nature of the relationship between two variables • In linear regression for example, the functional form of the linear relationship between a dependent variable (Y) and independent variable (X) is expressed as Y = α + βX where: Y = dependent variable; X = Independent variable; α = Intercept and β = regression coefficient or slope or amount of change in Y as a result of each unit change in X
T- DISTRIBUTION: • Used to compare two independent sets of data to find out if their means Ẋ1 and Ẋ1 show significant difference. • The null hypothesis is that Ẋ1 = Ẋ1 and that Ẋ1-Ẋ1 = 0 • The probability of being true is tested by estimating the standard error of the difference and using t-test. • It is assumed that both sets of data are derived from the same population with same standard deviation. • The equality of the means is what is in doubt. • Can be used to compare the performance of two similar drug or food dispensing equipment, or any observation that is naturally paired.
F- DISTRIBUTION • Comparison of two variances: it is the basis of analysis of variance involving the ratio of variance estimates • Useful in Analysis of Variance (ANOVA) tests (testing the assumptions that underline many statistical tests that two population variances are equal). • Finds great relevance in statistical designs of which the simplest is one-way analysis of Variance, also known as one way classification or Completely Randomized Design (CRD). • Testing multiple correlation coefficient
APPENDIX 1DATA FOR DESCRIPTIVE STATISTICS • The following data were generated during the feeding trial of albino rats. Weight of rats(g) 2, 1.5, 2.5, 2, 4, 3, 2.5, 2.5, 4, 4.5, 5 • Calculate the mean, mode, median, standard deviation, standard error and coefficient of variation
APPENDIX 2DATA FOR SIMPLE LINEAR CORRELATION AND REGRESSION • The data below are to determine the relationship between pH and presence of non-protein nitrogen in stored raw meat pH(X): 5.7 5.5 5.4 5.3 5.5 5.7 6.4 6.5 6.6 NPN(Y): 0.25 0.30 0.32 0.35 0.45 0.54 0.60 0.75 0.85 • Determine the Degree and Nature of the relationship
APPENDIX 3DATA FOR T-TEST • The following data were the results of check weighing from two filling machines (Machine A = MA and Machine B = MB) in factory producing a 60g pack of a product. MA: 61 63 60 64 62 62 59 61 64 62 MB: 61 62 59 59 62 62 64 60 60 59 Using t-test, determine if there is a significant difference in the deliveries of the two machines.
APPENDIX 4DATA FOR ONE-WAY ANOVA The data below represent the result of the effect of four different complimentary diets formulations on weight gain of infants using feeding trial of rat. Diet Replications(weight gains in grams per weighing period) D1 2.0 2.5 1.5 2.0 D2 4.0 3.0 2.5 2.5 D3 4.0 4.5 5.0 3.5 D4 4.5 3.5 2.5 4.5 Determine if there are significant differences in the ability of the complimentary diets to cause weight gain.