Download
1 / 22
230 likes | 441 Views
Create Your Reverse Logistics Financial Model. by John Mehrmann. Building a Financial Model. All financial models are not created equal There is no ‘one size fits all’ financial model A personal financial model is determined by Process Product Price Profit People Parts Performance

E N D
Create Your Reverse Logistics Financial Model by John Mehrmann
Building a Financial Model • All financial models are not created equal • There is no ‘one size fits all’ financial model • A personal financial model is determined by • Process • Product • Price • Profit • People • Parts • Performance • Provisions • Percentage • Perspective • The goal of this material is to give you building blocks for constructing your own financial model.
Process Product Sales • There are different perspectives to the impact of returns • Manufacturers may track return ratios by channel, while the channel may track returns by brand and model $ MSRP (Retail Price) $ LIC (Cost) $ BOM (Materials) Manufacturer PerspectiveCredit & Return Ratio $ Direct $ Retail $ VAR Retail PerspectiveReturn Ratio by Brand / Model $ Refund $ Replace Same Brand $ Replace Different Brand $ Time to Return $ RMA & Credit Policies $ Caps on Returns
Retail Return Impact View • Collect Data to compare Brand / Model Performance
Manufacturer View Product Sales • Freight and freight related charges • How many people touch the product or the process? • Are you tracking all of the costs? $ MSRP (Retail Price) $ LIC (Cost) $ BOM (Materials) $ Freight and $ Fuel Surcharges Return Center $ Receiving $ Sorting $ Inspection / Validation $ Credit Processing / Finance $ Operations Management $ Warehouse Space $ Ratio Good vs Bad Units $ Return Packaging
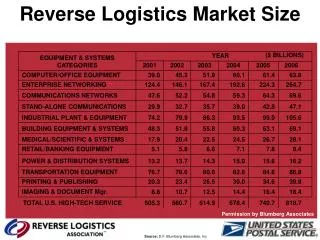
Trends • Tracking trends by sales channels and return ratios is an important step to forecast resources, storage, and budget impact for manufacturers. • Apply historical trends to forecasted future sales by channel and plan ahead.
Where are your Returns Received? 20% of Returns 80% of Returns • Freight and fuel charges are greatly impacted by the geographic location of the Returns Center compared to demographics and carrier (truck, rail, etc)
Return CenterHidden Costs • Facility • Manpower • Utilities • Fixed Expense • Variable Costs • Depreciation • IT Systems • What do you pay for?
After it is received . . . Product Sales Sell AS IS or SCRAP Return Center Hold – Accumulate Inventory at Full Book Value (Uh Oh) Future Financial Impact Return Product to Vendor for Warranty (ODM/OCM) $ Freight & Fuel Surcharges $ Inventory position $ Depreciation $ Warehouse Storage $ Operations and Accounting $ Shipping & Receiving $ Packing & Insurance Refurbish Product, Repair Parts from Vendor or Harvest
Global Economy $ Labor Rates $ ODM Part Warranty $ Variable Currency Exchange Rates $ Inventory Position $ Accumulated Shipments $ Import, Export, Duties, Tax $ Shipping, Receiving, Handling $ Depreciation in transit $ Freight Compare
Are you getting the most value? Harvest Parts for Refurbishing Refurbish Resale Value • Cost of Replacement Parts • Back-order Spare Parts Status Return Product • Cost of the sum of Parts compared to Product Value • Trend accumulated inventory, depreciation, and price erosion Harvest Parts for Warranty Customer Exchanges • Use Refurbished not NEW units • Replace rather than Refund • Product Resale Value and Parts Procurement costs change over time and must be updated
Accessories Debit Missing Accessories? Replenish? $ Manuals $ Cables $ Remotes $ AC Adapters $ Batteries $ Ear Buds $ CD’s / Software $ ______________ Inventory? Consumer Demand? • How many different ways are the same accessories carried in inventory? Same item with different part numbers and different locations?
Technology • Integration and automation • Improve tracking, planning, and productivity • Automate manual functions • Integration between retail dealer, return center, call center, service providers, ODM vendors, claims processing, collectors, recyclers, government, ODM, and OCM vendors • Track and trend Failure Rates, Return Ratios, and ROI • What is the ROI on your IT Architecture? • How is Technology used to plan decisions • When to refurbish • When to repair • When to harvest parts • etc
e-Waste • Growing awareness, concern, and cost. • Expense for collection, recycling, Certificates of Destruction, and related costs for environmental protection are creating new financial burdens by geographic region and product. • RoHS & WEEE Directives, Laws being drafted ongoing
Create your own model • Map your process • Define and measure each step in the process • Define movement between steps, movement = expense • Assign Metrics to each Step and Movement • Frequency • Severity or Cost • Resources or Manpower • Inventory Depreciation or Process Delay • Cost • Identify Variables • Adjustable Seasonal Headcount • Warehouse / Storage • Currency Exchange Rates, Duties, Fees • Find Hidden Costs • Examples: Accessories, Boxes and PackingMaterials, Utilities, Management, IT, etc
Map Your Process Wal-Mart Best Buy Circuit City SEARS Other Blanket Return Authorization / On-Line Entry / System Integration Options – RMA Options Logistics / Transportation Costs of Return Freight Consolidation and Receipt Confirmation Electronic / On-Line Alert Report to issue Credit Revenue Share (SCRAP) New Refurbish (Not New) Not Economical to Repair Asset Recovery Repair Parts In-House Repair TEST Time to Repair REPAIR MFFR Parts Stock Balance Consolidate Freight To/From Source QUALITY CONTROL ODM Parts • Quality Control • Engineering Lab • ISO9001/2000 • Technical Data • Failure Reports Package A B Source Parts Warehouse / Inventory Reseller Reseller Reseller
Compare Cost to Return on Investment 1 2 3 4 5 6 7 8 9 Simple Example
Look for ways to Simplify • Measure the cost for each step in the process.
Look for ways to Simplify • Measure the cost for each step in the process. • Then review options and calculate savings to reduce cost. • Measure the impact of your changes.
Can you think of some additional Cost Concerns that were not included in this overview?Share your experience.