Download
1 / 26
270 likes | 472 Views
The effects of investment in early education on economic growth. William Dickens, Isabel Sawhill, and Jeffrey Tebbs Economic Studies Program The Brookings Institution. Overview. Purpose: To simulate the impact of investments in kids on economic growth

E N D
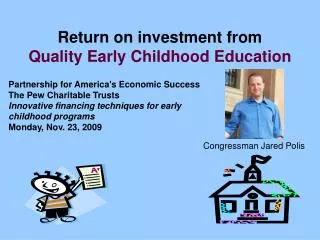
The effects of investment in early education on economic growth William Dickens, Isabel Sawhill, and Jeffrey Tebbs Economic Studies Program The Brookings Institution Investing in Kids Working Group
Overview • Purpose: To simulate the impact of investments in kids on economic growth • Approach: Creation of simple spread sheet adaptations of standard economic growth models with elaborate education sectors to allow quick and easy assessment of policy effects • Status: Work in progress. Preliminary results available. More work needed to verify model results, expand the range of models considered, and make spread sheets more user-friendly. Investing in Kids Working Group
Importance of Human Capital • Between 1959 and 1998, real output grew 3.6 percent per year on average. • Measurable improvements in human capital are thought to be responsible for at least 10% of the increase. • These improvements have slowed • May be more important than ever in post-industrial, knowledge-based economy Investing in Kids Working Group
Why An Educated Labor Force is more productive • Can use sophisticated technology, equipment • Learns new tasks and skills more easily • More creative, finds new ways of doing things • More autonomous, requires less supervision • Benefits accrue to firm but also to whole economy because quality of labor force dictates what kind of machines, technology, forms of organization can be used Investing in Kids Working Group
Economists Today Have Two Broad Approaches to Modeling Growth that Differ Mainly in their Treatment of the Source of Total Factor Productivity Growth Investing in Kids Working Group
What is Total Factor Productivity Growth and Where Does it Come From? • Normally we assume that if we double the amount of resources devoted to producing a particular type of output that it will double the amount of output we get • This is because we can always duplicate the original production process and get equal output from both halves • However, over time output grows more than can be accounted for by increases in capital, labor, and other factors – this is called total factor productivity growth Investing in Kids Working Group
Two Ways of Accounting for Total Factor Productivity Growth • Exogenous TFP Growth • This is the standard “neoclassical” or “Solow-Swann” growth model • Proportional increases in all factors leads to an equal proportional increase in output • TFP growth is “exogenous” which means that it proceeds at a given rate and does not respond to changes in the economy such as changes in the savings rate • This means that increased savings on education can increase output in the long run and rates of growth in the short run, but can’t affect the long run rate of growth Investing in Kids Working Group
Where Does Growth Come From? • Endogenous growth models attribute growth in TFP to a number of different factors and model the impact of changes in the economy and policy on: • Increases in the stock of knowledge • Economies of scale in catering to larger markets as the economy grows • The ability to enhance the productivity of labor with education (Uzawa 1965 and Lucas 1988) Investing in Kids Working Group
Is TFP Growth Endogenous(Does it Depend on Savings Rates and Policy)? • Mankiw, Romer and Weil (1992) argue that most of the differences in growth experience across countries can be accounted for by differing rates of growth of labor, physical capital, and human capital. • Bernanke and Gurkaynak (2001) counter that growth experience is significantly correlated with behavioral variables such as savings rates in ways that aren’t easy to explain in the exogenous growth model. Investing in Kids Working Group
We Present Results From Both Types of Models • Model 1: • Mankiw, Romer and Weil (1992) • Output is a function of stocks of labor, human capital, and physical capital • Constant returns to scale in these three inputs to production • Growth in TFP does not depend on policy inputs • Model 2: • Uzawa (1965) and Lucas (1988) • Output is a function of physical capital and effective labor services where the effectiveness of labor is enhanced by education. • Increasing the level of education increases TFP • If we add a feedback between the level of income and investment in education (via the savings rate), it causes a long term increase in the rate of growth Investing in Kids Working Group
Analysis Is Positive and Not Normative • Positive analysis is useful for determining fiscal impact (dynamic scoring) and distribution of benefits over time. • Growth effects are not additional net benefits. While they are additional benefits they involve additional costs (increased savings and therefore foregone consumption). • In some growth models there may be additional net benefits from spillover effects of education that would not be captured by a cost-benefit analysis that took into account only benefits accruing directly to affected individuals. Investing in Kids Working Group
Conceptual Flow Increased Educational Attainment Increased Stock of Human Capital Increased GDP Preschool Intervention Investing in Kids Working Group
Conceptual Flow Increased Savings Increased Physical Investment Increased Stock of Physical Capital Increased Educational Attainment Increased Stock of Human Capital Exogenous Growth Preschool Intervention Increased Income Increased Income Increased GDP Increased GDP Increased GDP Investing in Kids Working Group
Conceptual Flow Increased Savings Increased Physical Investment Increased Stock of Physical Capital Increased Educational Attainment Increased Stock of Human Capital Increased Educational Attainment Increased GDP Exogenous Growth Increased Savings Increased Savings Increased Investment in Human Capital Increased Investment in Human Capital Preschool Intervention Increased Income Increased Income Increased Income Increased GDP Investing in Kids Working Group
Conceptual Flow Increased Savings Increased Investment in Human Capital Increased Physical Investment Increased Stock of Physical Capital Increased Educational Attainment Exogenous Growth Increased Savings Increased Savings Increased Stock of Human Capital Preschool Intervention Increased Income Increased Income Increased Income Increased GDP Investing in Kids Working Group
Conceptual Flow Increased Savings Increased Investment in Human Capital Increased Physical Investment Increased Stock of Physical Capital Increased Educational Attainment Increased Stock of Human Capital Exogenous Growth Increased Savings Increased Savings Preschool Intervention Increased Income Increased GDP Investing in Kids Working Group
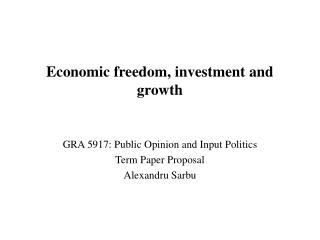
Conceptual Flow Increased Investment in Human Capital Increased Physical Investment Increased Stock of Physical Capital Increased Educational Attainment Increased Educational Attainment Exogenous Growth Increased Savings Increased Stock of Human Capital Increased Stock of Human Capital Preschool Intervention Preschool Intervention Increased Income Increased GDP Increased GDP Increased Productivity of Labor and Capital Increased Productivity of Labor and Capital Endogenous Growth Investing in Kids Working Group
Choice of Policy Input • Core Input to Model: Average Increase in Educational Attainment • Preferred policy input is derived from Abecedarian preschool experiment in North Carolina. • Abecedarian program provided low-income, at-risk children with year-round, full-time care, five days per week, 50 weeks per year from age zero to age five. • Average increase in educational attainment in treatment relative to control group (at age 21): 0.6 years. • Following the policy proposal crafted by Jens Ludwig and Isabel Sawhill in “Success by Ten: Intervening Early, Often, and Effectively in the Education of Young Children,” we apply an Abecedarian-type policy initiative to the poorest 20% of the population. • 0.6 yr x 20% = 0.12 yr avg. increase in educational attainment • Source: “Early Childhood Education: Young Adult Outcomes from the Abecedarian Project,” Campbell, Ramey, et al, 2002, pp.48,51. Investing in Kids Working Group
Preliminary Results Exogenous Model Investing in Kids Working Group
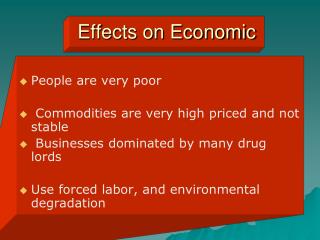
Preliminary Results Endogenous Model Investing in Kids Working Group
$9.64 trillion cumulative gain by 2080 2048-2049: Breakeven Point Preliminary Results Endogenous Model Investing in Kids Working Group
Sensitivity Analysis Parameter Values Investing in Kids Working Group
Sensitivity Analysis Parameter Values (Continued) Investing in Kids Working Group
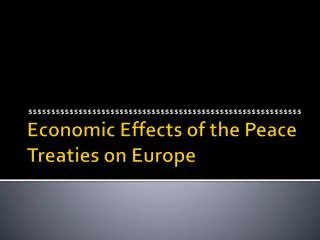
Sensitivity Analysis Percentage Increase in GDP in 2080 with Preferred Parameter Values: 1.10% Percentage Increase in GDP in 2080 with Preferred Parameter Values: 0.70% Investing in Kids Working Group
Sensitivity Analysis Assumptions regarding two key parameters dramatically affect results. (1) Rate of return on education. Private return may exceed societal gain from educational attainment (e.g., the value of education as a sorting mechanism). Parameter value may be upward biased. (2) Magnitude of preschool initiative’s effect on educational attainment. Over full life-cycle, average increase in educational attainment may exceed +0.6 years. Abecedarian follow-up occurred at age 21. College-going rate was nearly 2.5x larger for treatment group. Strong possibility of downward bias in current estimate. We analyze +/- 1 standard error of the estimate of the difference between the treatment and the control. Investing in Kids Working Group
Model Demonstration Investing in Kids Working Group