Download
1 / 1
10 likes | 98 Views
The Intra-Americas low-level jet * Jorge A. Amador 1,2 and Kingtse Mo 3 1 Center for Geophysical Research, 2 School of Physics, University of Costa Rica; 3 Climate Prediction Center, NCEP/NWS/NOAA * Submitted to Journal of Climate (October 2005). Abstract

E N D
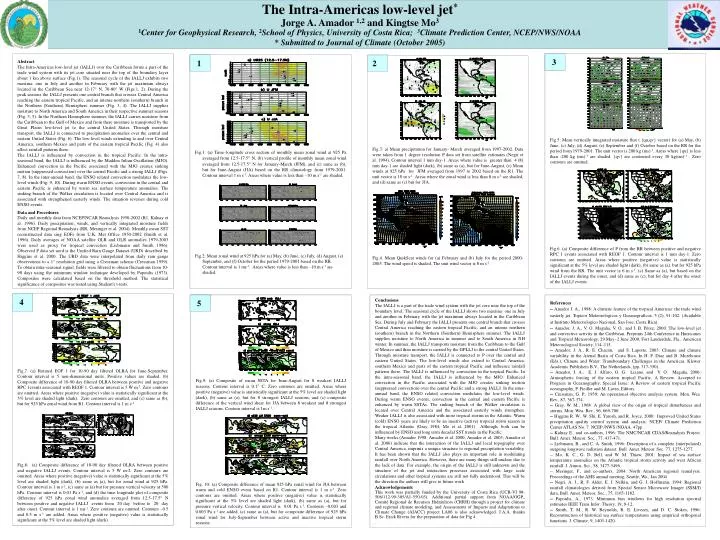
The Intra-Americas low-level jet* Jorge A. Amador 1,2and Kingtse Mo3 1Center for Geophysical Research, 2School of Physics, University of Costa Rica; 3Climate Prediction Center, NCEP/NWS/NOAA * Submitted to Journal of Climate (October 2005) Abstract The Intra-Americas low-level jet (IALLJ) over the Caribbean forms a part of the trade wind system with its jet core situated near the top of the boundary layer about 1 km above surface (Fig.1). The seasonal cycle of the IALLJ exhibits two maxima: one in July and another in February with the jet maximum always located in the Caribbean Sea near 12-17° N, 70-80° W (Figs.1, 2). During the peak seasons the IALLJ presents one central branch that crosses Central America reaching the eastern tropical Pacific, and an intense northern (southern) branch in the Northern (Southern) Hemisphere summer (Fig. 3, 4). The IALLJ supplies moisture to North America and South America in their respective summer seasons (Fig. 3, 5). In the Northern Hemisphere summer, the IALLJ carries moisture from the Caribbean to the Gulf of Mexico and from there moisture is transported by the Great Plains low-level jet to the central United States. Through moisture transport, the IALLJ is connected to precipitation anomalies over the central and eastern United States (Fig. 6). The low-level winds extending to and over Central America, southern Mexico and parts of the eastern tropical Pacific (Fig. 4) also affect rainfall patterns there. The IALLJ is influenced by convection in the tropical Pacific. In the intra-seasonal band, the IALLJ is influenced by the Madden Julian Oscillation (MJO). Enhanced convection in the Pacific associated with the MJO creates sinking motion (suppressed convection) over the central Pacific and a strong IALLJ (Figs. 7, 8). In the inter-annual band, the ENSO related convection modulates the low-level winds (Fig. 9, 10). During warm ENSO events, convection in the central and eastern Pacific is enhanced by warm sea surface temperature anomalies. The sinking branch of the Walker circulation is located over Central America and is associated with strengthened easterly winds. The situation reverses during cold ENSO events. Data and Procedures Daily and monthly data from NCEP/NCAR Reanalysis 1950-2002 (R1, Kalnay et al. 1996). Daily precipitation, winds, and vertically integrated moisture fields from NCEP Regional Reanalysis (RR, Mesinger et al. 2004). Monthly mean SST reconstructed data sing EOFs from U.K. Met Office 1950-2002 (Smith et al. 1996). Daily averages of NOAA satellite OLR and OLR anomalies 1979-2003 were used as proxy for tropical convection (Liebmann and Smith 1996). Observed P data set used is the Unified Rain Gauge Dataset (URD) described by Higgins et al. 2000. The URD data were interpolated from daily rain gauge observations to a 1° resolution grid using a Cressman scheme (Cressman 1959). To obtain intra-seasonal signal, fields were filtered to obtain fluctuations from 10-90 days using the minimum window technique developed by Papoulis (1973). Composites were calculated based on the threshold method. The statistical significance of composites was tested using Student's t-tests. Fig.5: Mean vertically integrated moisture flux ( {qu,qv} vector) for (a) May, (b) June, (c) July, (d) August, (e) September and (f) October based on the RR for the period from 1979-2001. The unit vector is 200 kg (ms)-1. Areas where {qu} is less than -200 kg (ms)-1 are shaded. {qv} are contoured every 30 kg(ms)-1 . Zero contours are omitted. Fig.6. (a) Composite difference of P from the RR between positive and negative RPC 1 events associated with REOF 1. Contour interval is 1 mm day-1. Zero contours are omitted. Areas where positive (negative) value is statistically significant at the 5% level are shaded light (dark), (b) same as (a), but for 925 hPa wind from the RR. The unit vector is 6 m s-1, (c) Same as (a), but based on the IALLJ events during the onset, and (d) same as (c), but for day 4 after the onset of the IALLJ events 3 Fig.1: (a) Time–longitude cross section of monthly mean zonal wind at 925 Pa averaged from 12.5-17.5° N, (b) vertical profile of monthly mean zonal wind averaged from 12.5-17.5° N for January-March (JFM), and (c) same as (b), but for June-August (JJA) based on the RR climatology from 1979-2001. Contour interval 1 m s-1. Areas where value is less than –10 m s-1 are shaded. Fig.2: Mean zonal wind at 925 hPa for (a) May, (b) June, (c) July, (d) August, (e) September, and (f) October for the period 1979-2001 based on the RR. Contour interval is 1 ms-1. Areas where value is less than –10 m s-1 are shaded. 1 2 Fig.3: a) Mean precipitation for January- March averaged from 1997-2002. Data were taken from 1 degree resolution P data set from satellite estimates (Negri et al. 1994). Contour interval 1 mm day-1 .Areas where value is greater than 4 (8) mm day-1 are shaded light (dark), (b) same as (a), but for June-August, (c) Mean winds at 925 hPa for JFM averaged from 1997 to 2002 based on the R1. The unit vector is 10 m s-1. Areas where the zonal wind is less than 8 m s-1 are shaded, and (d) same as (c) but for JJA. Fig.4. Mean QuikScat winds for (a) February and (b) July for the period 2000-2005. The wind speed is shaded. The unit wind vector is 8 m s-1. 4 Fig.7. (a) Rotated EOF 1 for 10-90 day filtered OLRA for June-September. Contour interval is 5 non-dimensional units. Positive values are shaded. (b) Composite difference of 10-90 day filtered OLRA between positive and negative RPC 1events associated with REOF 1. Contour interval is 5 W m-2. Zero contours are omitted. Areas where positive (negative) value is statistically significant at the 5% level are shaded light (dark). Zero contours are omitted, and (c) same as (b), but for 925 hPa zonal wind from R1. Contour interval is 1 m s-1. Fig.8: (a) Composite difference of 10-90 day filtered OLRA between positive and negative IALLJ events. Contour interval is 5 W m-2. Zero contours are omitted. Areas where positive (negative) value is statistically significant at the 5% level are shaded light (dark), (b) same as (a), but for zonal wind at 925 hPa. Contour interval is 1 m s-1, (c) same as (a) but for pressure vertical velocity at 500 hPa. Contour interval is 0.01 Pa s-1, and (d) the time longitude plot of composite difference of 925 hPa zonal wind anomalies averaged from 12.5-17.5° N between positive and negative IALLJ events from 20 day before to 20 day after onset. Contour interval is 1 ms-1. Zero contours are omitted. Contours –0.5 and 0.5 m s-1 are added. Areas where positive (negative) value is statistically significant at the 5% level are shaded light (dark). 5 Fig.9: (a) Composite of mean SSTA for June-August for 8 weakest IALLJ seasons. Contour interval is 0.1° C. Zero contours are omitted. Areas where positive (negative) value is statistically significant at the 5% level are shaded light (dark), (b) same as (a), but for 8 strongest IALLJ seasons, and (c) composite difference of the vertical wind shear for JJA between 8 weakest and 8 strongest IALLJ seasons. Contour interval is 1m s-1. Fig. 10: (a) Composite difference of mean 925 hPa zonal wind for JJA between warm and cold ENSO evens based on R1. Contour interval is 1 m s-1. Zero contours are omitted. Areas where positive (negative) value is statistically significant at the 5% level are shaded light (dark), (b) same as (a), but for pressure vertical velocity. Contour interval is 0.01 Pa s-1. Contours –0.003 and 0.003 Pa s-1 are added, (c) same as (a), but for composite difference of 925 hPa zonal wind for July-September between active and inactive tropical storm seasons. Conclusions The IALLJ is a part of the trade wind system with the jet core near the top of the boundary level. The seasonal cycle of the IALLJ shows two maxima: one in July and another in February with the jet maximum always located in the Caribbean Sea. During July and February the IALLJ presents one central branch that crosses Central America reaching the eastern tropical Pacific, and an intense northern (southern) branch in the Northern (Southern) Hemisphere summer. The IALLJ supplies moisture to North America in summer and to South America in NH winter. In summer, the IALLJ transports moisture from the Caribbean to the Gulf of Mexico and then moisture is carried by the GPLLJ to the central United States. Through moisture transport, the IALLJ is connected to P over the central and eastern United States. The low-level winds also extend to Central America, southern Mexico and parts of the eastern tropical Pacific and influence rainfall patterns there. The IALLJ is influenced by convection in the tropical Pacific. In the intra-seasonal band, the IALLJ is influenced by the MJO. Enhanced convection in the Pacific associated with the MJO creates sinking motion (suppressed convection) over the central Pacific and a strong IALLJ. In the inter-annual band, the ENSO related convection modulates the low-level winds. During warm ENSO events, convection in the central and eastern Pacific is enhanced by warm SSTAs. The sinking branch of the Walker circulation is located over Central America and the associated easterly winds strengthen. Weaker IALLJ is also associated with more tropical storms in the Atlantic. Warm (cold) ENSO years are likely to be an inactive (active) tropical storm season in the tropical Atlantic (Gray 1984; Mo et al. 2001) Although, both can be influenced by ENSO and long term decadal SST trends in the Pacific. Many works (Amador 1998, Amador et al. 2000, Amador et al. 2003; Amador et al. 2006) indicate that the interaction of the IALLJ and local topography over Central America, imprints a unique structure to regional precipitation variability. It has been shown that the IALLJ also plays an important role in modulating rainfall over North America. However, there are many things still unclear due to the lack of data. For example, the origin of the IALLJ is still unknown and the structure of the jet and interaction processes associated with large scale circulations and other tropical systems are still not fully understood. This will be the direction the authors will give to future work Acknowledgements This work was partially funded by the University of Costa Rica (UCR-VI 98-506/112-99-305/A1-550-03). Additional partial support from NOAA/OGP,, Comité Regional de Recursos Hidráulicos (CRRH) through a project for climate and regional climate modeling, and Assessments of Impacts and Adaptations to Climate Change (AIACC) project LA06 is also acknowledged. J.A.A. thanks B.Sc. Erick Rivera for the preparation of data for Fig 4. . References -- Amador J. A., 1998: A climatic feature of the tropical Americas: the trade wind easterly jet. Topicos Meteorologicos y Oceanograficos. 5 (2), 91-102. (Available at Instituto Meteorologico Nacional, San Jose, Costa Rica) -- Amador, J. A., V. O. Magaña, V. O., and J. B. Pérez, 2000: The low-level jet and convective activity in the Caribbean. Preprints 24th Conference in Hurricanes and Tropical Meteorology, 29 May–2 June 2000, Fort Lauderdale, Fla., American Meteorological Society, 114–115. -- Amador, J. A., R. E. Chacón, and S. Laporte, 2003: Climate and climate variability in the Arenal Basin of Costa Rica. In H. F. Diaz and B. Morehouse (Eds.), Climate and Water: Transboundary Challenges in the Americas. Klewer Academic Publishers B.V., The Netherlands, (pp. 317-350). -- Amador, J. A., E. J. Alfaro, O. G. Lizano, and V. O. Magaña, 2006: Atmospheric forcing of the eastern tropical Pacific. A Review. Accepted to Progress in Oceanography, Special Issue: A Review of eastern tropical Pacific oceangraphy, P. Fiedler and M. Lavin, Editors. -- Cressman, G. P., 1959: An operational objective analysis system. Mon. Wea. Rev., 87, 367-374. -- Gray, W. M., 1968: A global view of the origin of tropical disturbances and storms. Mon. Wea. Rev., 96, 669-700. -- Higgins R. W., W. Shi, E. Yarosh, and R. Joyce, 2000: Improved United States precipitation quality control system and analysis. NCEP/ Climate Prediction Center ATLAS No. 7. NCEP /NWS /NOAA. 47pp. -- Kalnay E., and co‑authors, 1996: The NMC/NCAR CDAS/Reanalysis Project. Bull. Amer. Meteor. Soc., 77, 437‑471. -- Liebmann, B., and C. A. Smith, 1996: Description of a complete (interpolated) outgoing longwave radiation dataset. Bull. Amer. Meteor. Soc. 77, 1275-1277. • - Mo, K. C., G. D. Bell, and W. M. Thiaw, 2001: Impact of sea surface temperature anomalies on the Atlantic tropical storm activity and west African rainfall. J. Atmos. Sci., 58, 3477-3496. • - Mesinger, F., and co-authors, 2004: North American regional reanalysis. Proceedings of the AMS annual meeting, Seattle, Wa., Jan 2004 -- Negri, A. J., R. F. Alder, E. J. Nelkin, and G. J. Hoffmann, 1994: Regional rainfall climatologies derived from Special Sensor Microwave Imager (SSM/I) data, Bull. Amer. Meteor. Soc., 75, 1165-1182. -- Papoulis, A., 1973: Minimum bias windows for high resolution spectral estimates IEEE Trans Infor. Theory, 19, 9-12. -- Smith, T. M., R. W. Reynolds, R. E. Livezey, and D. C. Stokes, 1996: Reconstruction of historical sea surface temperatures using empirical orthogonal functions. J. Climate, 9, 1403-1420.