Download
1 / 22
220 likes | 373 Views
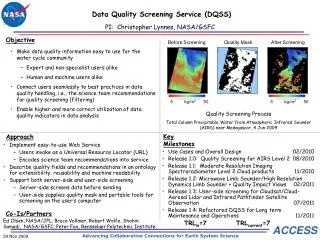
A Data Quality Screening Service for Remote Sensing Data. Christopher Lynnes, NASA/GSFC Edward Olsen, NASA/JPL Peter Fox, RPI Bruce Vollmer, NASA/GSFC Robert Wolfe, NASA/GSFC. Contributions from : N. Most, Y.-I. Won, T. Hearty, R. Strub, S. Ahmad, S. Zednik, M. Hegde and A. Rezaiyan-Nojani.

E N D
A Data Quality Screening Service for Remote Sensing Data Christopher Lynnes, NASA/GSFC Edward Olsen, NASA/JPL Peter Fox, RPI Bruce Vollmer, NASA/GSFC Robert Wolfe, NASA/GSFC Contributions from: N. Most, Y.-I. Won, T. Hearty, R. Strub, S. Ahmad, S. Zednik, M. Hegde and A. Rezaiyan-Nojani Funded by: NASA’s Advancing Collaborative Connections for Earth System Science (ACCESS) Program
Outline Why a Data Quality Screening Service? Making Quality Information Easier to Use via the Data Quality Screening Service (DQSS) Future Directions for DQSS
The quality of AIRS data varies considerably Version 5 Level 2 Standard Retrieval Statistics
Quality schemes can be relatively simple… Total Column Precipitable Water Qual_H2O kg/m2 Best Good Do Not Use
…or they can be more complicated Hurricane Ike, viewed by the Atmospheric Infrared Sounder (AIRS) Air Temperatureat 300 mbar PBest : Maximum pressure for which quality value is “Best” in temperature profiles
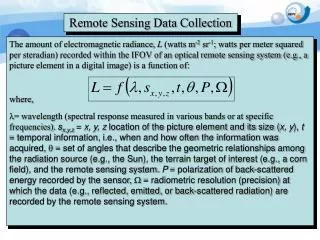
Quality flags are also sometimes packed together into bytes Cloud Mask Status Flag 0=Undetermined1=Determined Day / Night Flag 0=Night1=Day Snow/ Ice Flag 0=Yes1=No Sunglint Flag 0=Yes1=No Cloud Mask Cloudiness Flag 0=Confident cloudy 1=Probably cloudy 2=Probably clear 3=Confident clear Surface Type Flag 0=Ocean, deep lake/river 1=Coast, shallow lake/river 2=Desert 3=Land Bitfield arrangement for the Cloud_Mask_SDS variable in atmospheric products from Moderate Resolution Imaging Spectroradiometer (MODIS)
Current user scenarios... Repeat for each user • Nominal scenario • Search for and download data • Locate documentation on handling quality • Read & understand documentation on quality • Write custom routine to filter out bad pixels • Equally likely scenario (especially in user communitiesnot familiar with satellite data) • Search for and download data • Assume that quality has a negligible effect
The effect of bad qualitydata is often not negligible Hurricane Ike, 9/10/2008 Total Column Precipitable Water Quality Best Good Do Not Use kg/m2
Neglecting quality may introduce bias (a more subtle effect) AIRS Relative Humidity Comparison against Dropsonde with and without Applying PBest Quality Flag FilteringBoxed data points indicate AIRS RH data with dry bias > 20% From a study by Sun Wong (JPL) on specific humidity in the Atlantic Main Development Region for Tropical Storms
Making Quality Information Easier to Use via the Data Quality Screening Service (DQSS).
The DQSS filters out bad pixels for the user • Default user scenario • Search for data • Select science team recommendation for quality screening (filtering) • Download screened data • More advanced scenario • Search for data • Select custom quality screening parameters • Download screened data
DQSS replaces bad-quality pixels with fill values Original data array (Total column precipitable water) Mask based on user criteria (Quality level < 2) Good quality data pixels retained Output file has the same format and structure as the input file (except for extra mask and original_data fields)
Visualizations help users see the effect of different quality filters Data withinproduct file Best quality only Best + Good quality
DQSS can encode the science team recommendations on quality screening • AIRS Level 2 Standard Product • Use Best-only for data assimilation uses • Use Best+Good for climatic studies • MODIS Aerosols • Use only VeryGood over land • Use Marginal+Good+VeryGood over ocean
Or, users can select their own criteria... Initial settings are based on Science Team recommendation. (Note: “Good” retains retrievals that Good or better). You can choose settings for all parameters at once... ... or parameter by parameter.
DQSS Status • DQSS is operational for AIRS L2 Standard Products • DQSS is offered through the Mirador data search interface at the GES DISC • Usage Metrics will be collected: • Basic usage • What criteria are used • Screening invocation is a simple URL GET • What the “ yield” was for the screening (future)
Future: Extend DQSS to Other Datasets Moderate Resolution Imaging Spectroradiometer (MODIS) L2 Atmospheres Microwave Limb Sounder (MLS) L2 Ozone Monitoring Instrument (OMI) L2 High-Resolution Dynamics Limb Sounder (HIRDLS)
Combine DQSS with Other Services Subsetting Reformatting to NetCDF OPeNDAP Suggestions?
DQSS Recap • Screening satellite data can be difficult and time consuming for users • The Data Quality Screening System will provide an easy-to-use service • The result should be: • More attention to quality on users’ part • More accurate handling of quality information… • …With less user effort