Download
1 / 85
860 likes | 1.09k Views
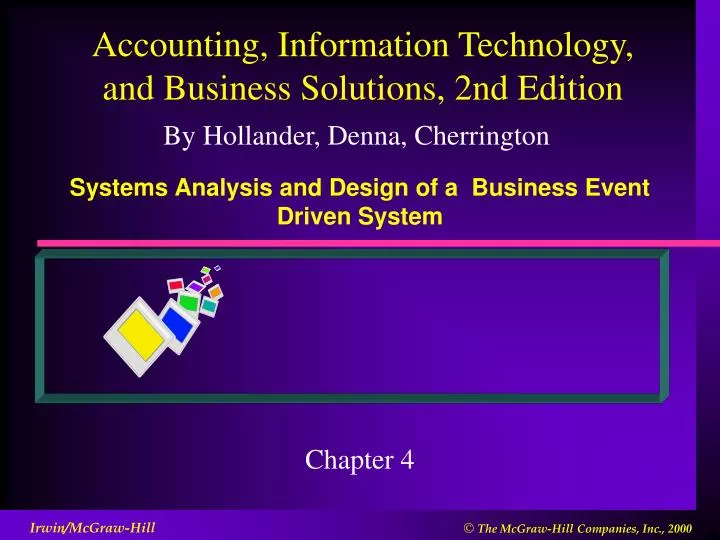
Systems Analysis and Design of a Business Event Driven System. Chapter 4. Objective. The objective of this chapter is to help you understand the key steps in analyzing and designing information technology (IT) applications. Analysis and Design of a Business Event-driven IT Application.

E N D
Systems Analysis and Design of a Business Event Driven System Chapter 4
Objective • The objective of this chapter is to help you understand the key steps in analyzing and designing information technology (IT) applications.
Analysis and Design of a Business Event-driven IT Application • Designing quality IT applications requires a thorough understanding of the organization including its current and desired objectives, strategies, value chains, risks, and business processes • There are a variety of methods for analyzing and designing information systems. • How do professionals move from a business need for information to creating the physical IT infrastructure that can provide that information?
Systems Analysis and Design Methods • Exhibit 1 presents a systems analysis and design life cycle (SDLC) by J.A. Hoffer, J.F. George, and J.S. Valacich • Exhibit 2 displays the systems development processpresented by J.L. Whitten, L.D. Bentley, and V.M. Barlow • Other analysis and design approaches, including • object-oriented analysis and design, • prototyping, • systems engineering, • joint application design, • participatory design, • essential system design, • automating the SDLC using CASE tools
Project Identification and Selection I. The Analysis Phase – determining systems requirements and structuring the requirements by creating process models, logical models, and conceptual data models. IV. The Implementation and Maintenance Phase – performing system coding, testing, installing, documenting, user training, supporting users, and maintaining the system. Project Initiation Analysis III. The Physical Design Phase – designing physical files, databases, and programming instructions. Logical Design II. The Logical Design Phase – developing the logical design of the database and designing forms, reports, interfaces, and dialogues. Physical Design Implementation Maintenance Steps of a Systems Analysis and Design Life Cycle (SDLC) J.A. Hoffer, J.F. George, and J.S. Valacich, Modern Systems Analysis and Design, Reading, Massachusetts: Addison Wesley, 1999.
The Systems Development Process Systems Planning Existing systemdetails and limitations Planned applicationdevelopment process Existing system detailsand limitations Systems Support Systems Analysis Businessrequirementsstatement Productioninformationsystem Technicaldesignstatement Systems Implementation Systems Design J.L. Whitten, L.D. Bentley, and V.M. Barlow, Systems Analysis and Design, instructors ed., 3rd ed. Burr Ridge, Ill.: Richard D. Irwin, 1994.
Phase 1: Systems Analysis • Step 1-A: Defining systems requirements • Step 1-B: Structuring systems requirements using process modeling • Step 1-C: Structuring systems requirements using logical models • Step 1-D: Structuring systems requirements using conceptual data modeling • Step 1-E: Selecting a design strategy Process Modeling Logical Models Conceptual data modeling
STEP I-A: Systems Analysis - Defining Systems Requirements • After an organization has: • identified the need for a system project and • has successfully made a business case to justify investing the time and funds necessary to undertake the project, • a project team organizes and plans the work to be completed. • The team considers the costs, benefits, feasibility, responsibilities, and project timeline. • After completing these details they define the system requirements: • What are the expectations of this system? • What work and decisions will it support? • What objectives will it help the organization to accomplish?
Defining Systems Requirements • Your business analysis highlights the activities that an organization needs to perform effectively and efficiently to accomplish its objectives. • An information system should support these activities. • Add information processes, including data stores, and data flows, to the analysis • Consider the desired environment and envision innovative ways for the system to enable organization objectives and desired processes.
Order personnel Reporting useful information to information customers takes Receive customer order includes Inventory Customer places Maintaining reference data about resources, agents, and locations goes to Recording operating event data Shippingpersonnel is made up of Ship Order executes Shipping firm carried by is kept at Collect payment increases sends Bank Cash Cashier takes in Exhibit 4-3 Christopher Inc. REAL Model Resources Agents Events Christopher Inc. provides baseball caps to major league baseball teams to sell in their ballparks. While analyzing their business process, Christopher’s analysis team identified three key operating activities: receive orders from baseball teams (who are Christopher’s customers), package and ship caps to the teams (the sale of merchandise), and receive payment from the teams
Data Response Recording Process Stimulus Notification Maintaining Process • To support a business process, a system must collect data about the resources, agents, and locations that define the operating events. The system must allow the data to be kept current. • Maintaining reference data involves adding, deleting, or modifying data about resources, agents, and locations (e.g., changing products offered by a vendor; changing an employee's marital status; and adding a new vendor to the vendor list). • The objective is to maintain accurate, complete, and timely data about the resources, agents, and locations involved in operating events for the process you are modeling. • The reporting processes extract and convert stored data about events, resources, agents, and locations into information, and formatting the information for presentation to information customers. • These views often consist of financial and performance measures and may take the form of hardcopy source documents, hardcopy reports, electronic data flows, or ad hoc queries. • These data flows authorize actions, provide documentation to other business functions or to outside parties, and support both operational and strategic decision making. Stimulus • Executing each operating event triggers the need to record descriptive data about the event. • When data is captured while the operating event occurs, the recording process can execute business rules specified by management for each operating event. • These rules are the guidelines, standards, policies, and/or procedures intended to increase operational and information quality by reducing such problems as errors, irregularities, or fraud. Ideally, the execution of the operating event and the related information process occur simultaneously. Data Response Notification Reporting Process Data Response Stimulus Notification The Structure of Information Processes
STEP I-B: Systems Analysis - Structuring Systems Requirements Using Process Modeling • Some analysis methods create several versions of data flow diagrams, including • context data flow diagrams, • data flow diagrams of the current physical system, data flow diagrams of the current logical system, and • data flow diagrams of the proposed logical system. • Often, each data flow diagram includes a thorough description of each data flow.
Order Desired Information Decision Makers Customers Shipping/Bill Payment Shipping Data Carriers Confirmation Exhibit 4-4Christopher Inc., Context Diagram • A context diagram shows the sources and destinations of the data that are outside the boundaries or scope of the system being analyzed. • You do not show the data stores and data flows withinthe boundaries of the system. O Sales / collection system the circle represents computer processing Christopher Inc. needs a system that enables communication with customers several times during the process (e.g., customers send in order data as well as payment data, and Christopher Inc. sends back shipping, sales, billing, and payment data). Christopher Inc. needs a system that allows them to send shipping data to their carriers and receive shipment confirmations from their carriers. Finally, Christopher Inc.’s systems should allow access by internal agents (such as management and other decision-makers) to critical data and information.
Exhibit 4-5 Christopher, Inc. Level 0 Data Flow Diagram 1.0 Process customer orders Desired information Orders Shipping request data 2.0 Process shipments to customers Desired information Decision makers Bill Customers Payments due data Payment Desired information 3.0 Process payments from customers
Exhibit 4-6 Christopher Inc., Level 1 Data Flow Diagram Customer order data Approved Order Order 1.1 Approve and record customer order data Order data 1.2 Generate information about orders Desired information Shipping Request Data
Context Dictionary • Some analysts like to add more detail to context and other data flow diagrams, by providing the data elements that comprise the data flows on the diagram. We will refer to these data flow details as the context dictionary. Each entry in the context dictionary is separated from its definition by an equal sign (=) and is defined using the following set of symbols: • + To connect elements of the definition • {} To identify repeating elements of the definition
Sample Context Dictionary Entries • Sales-Invoice = Invoice # + Sale-Date + Register # + Customer Name + Salesperson Name + {Merchandise Name + Qty-Sold + Price + Item-Total} + Sale-Total • Customer-Profile = Report-Date + Name + State + Birth date + Telephone + {Merchandise Description + Qty-Sold} • Product-Sales = Report-Date + {Merchandise # + Merchandise Description + Qty-Sold + %Margin + $ Contribution} • Accounting-Revenue = Report-Date + Reporting-Period + Revenue for Reporting-Period • Sales-by-Salesperson = Report-Date + {Salesperson Name + {Merchandise-Description + Qty-Sold + $ Contribution} + Total Sales + Total Contribution
Additional Prototyping Steps When you are creating data flow diagrams or work-flows for a business process, how do you know how many recording, maintaining, and reporting processes you need for an IT application? You can use your REAL model and the context diagram as a guide. The number of reporting processes required for an application is a function of the number of views required by information customers. You will need one reporting process for each required output view. To help you plan, determine how many of the following three types of reporting output views your information customers need: - Source documents: printed or electronic transmission of event data documentation - Preformated reports: reports that are regularly used by information customers -Ad hoc reports: reports that information customers design and request to provide a new view or a view that is rarely used • context diagram • inflows and outflows to • Record event data • Maintain resource, agent, location data • Report source documents, queries, reports You need one recording process in your IT application for each business event object in the application’s REAL model You need one maintenance process in your IT application for each resource, agent, and location object in the application’s REAL model
McKell's Retail Sale Store Case Checkpoint • Reporting processes to handle key management functions: • Sales Invoice - the customer's bill; • Customer Profile - a report that provides information about customers and their purchasing habits; • Product Sales - a report that provides the margin and contribution for each merchandise items type sold; • Accounting Revenue - a report that provides a calculation of sales revenue for a specific period; • Sales by Salesperson - a report that details the merchandise and contribution to sales revenue for each salesperson) • Four maintenance processes • Maintain Customer Data, • Maintain Merchandise Data, • Maintain Salesperson Data, and • Maintain Register Data • to keep our resource, agent, and location data up to date and valid • Using our retail sale example, the IT application would have: • One recording process (i.e., Record Sale Data) to record the one event of interest
Step 1-C Structuring Systems Requirements Using Logical Models • After completing data flow diagrams that graphically show the flow of data to fulfill the system requirements, many analysts use logic models to represent the logic of the information processes denoted in the data flow diagram(s). • Their objective is to produce structured descriptions and diagrams that enumerate the logic contained in each process denoted in the data flow diagram(s). • Techniques used during this step include structured English, decision tables, decision trees, and state-transition diagrams or tables. • We will overview just one of these techniques: Structured English.
Structured English • Structured English is used to plan and document the steps of a computer instruction set (a program) without using a programming language. Structured English is used to define the detailed logic of each information process (Exhibit 4-7). • Structured English focuses on conciseness and clarity to document the essence of an information process and eliminates: • Adjectives. • Adverbs. • Compound sentences. • Non-imperative expressions. • All but a limited set of conditional and logic structures. • Most punctuation. • Footnote type details.
Exhibit 4-7 Structured English Example Process Data Input For each Customer-Order do the following: 1. Search for Customer-Name if found Confirm customer info with customer if not found Enter customer data 2. Check for availability of inventory requested if available Confirm ship-to-information if not available Inform customer with Order-Confirmation 3. Provide customer with Order-Confirmation 4. Send notification to packing agents Output
Business Event Risks • In addition to including the logic for completing a desired task, this step provides an opportunity for thinking about ways information technology can be used to help reduce business and information risks • An operating event occurring at the wrong time or sequence. • An operating event occurring without proper authorization. • An operating event involving the wrong internal agent. • An operating event involving the wrong external agent. • An operating event involving the wrong resource. • An operating event involving the resource amount. • An operating event occurring at the wrong location.
Information Event Risks • Information event risks include the risks associated with incomplete, inaccurate, or unauthorized recording, maintaining, and reporting information activities: • Recording risks - Recording risks include recording incomplete, inaccurate, or invalid data about an operating event. Incomplete data results in not recording all of the relevant characteristics about an operating event in the data stores. Inaccuracies arise from recording data that does not accurately represent the event. Invalid refers to data that are recorded about a fabricated event. • Maintaining risks - Maintaining risks are essentially the same as recording risks. The only difference is that the data maintained relates to resources, agents, and locations rather than operating events. • Reporting risks - Reporting risks include data that are improperly classified, improperly summarized, provided to unauthorized parties, or not provided in a timely manner.
STEP I-D: Systems Analysis: Structuring Systems Requirements Using Conceptual Data Modeling • To focus on the specific data you want to capture to describe reality and generate needed outputs we use a conceptual data model. • Conceptual data models represent the entities or objects you want to collect data about, and rules about the meaning and interrelationships among these data objects. • To complete this step, most analysts use one of two modeling techniques: Entity-Relationship (E-R) or Object Oriented (OO).
ERD • Data Entity • anything, real or abstract, about which we want to store data. • synonyms include entity type, entity class or object • Data relationship • a natural association that exists between one or more entities • business activities or events that link one or more entities EntityName RelationshipName
Places/ orIs Placed By Contains orIs Contained By Example Customer Orders Supplies
Entities • AGENTS • Entities that describe roles played in a system. They usually represent people or organizations. • ACCOUNT, AGENCY, ANIMAL, APPLICANT, BORROWER, CHILD, CLASS, CLIENT, CONTRACTOR, CREDITOR, DEPARTMENT, EMPLOYEE, EMPLOYER, INSTRUCTOR, MANAGER, OFFICE, SALESPERSON, SUPPLIER, TEAM, VENDOR
Entities • RESOURCES • Entities that describe tangible things. Most tangible things are easy to identify because you can see them. • BOOK, CHEMICAL, COURSE, DISK, EQUIPMENT, MACHINE, MATERIAL, METAL ,PART, PRODUCT, PROGRAM, SERVICE, SUBSTANCE, VEHICLE
Entities • EVENTS • Most events are easy to identify because the business records data on forms or files. • Events are characterized by the fact that they happen or have duration • AGREEMENT, APPLICATION, APPOINTMENT, ASSIGNMENT, BACKORDER, BUDGET, CLAIM, CONTRACT, DEPOSIT, DISBURSEMENT, FORECAST, INVOICE, JOB, LICENSE, PAYMENT, PURCHASE ORDER, REGISTRATION, RESERVATION, RESUME, SEMESTER, SHIPMENT, STEP, TASK, TEST, WORK ORDER
Entities • LOCATIONS • Entities that describe locations • BRANCH, BUILDING, CAMPUS, CITY, COUNTRY, COUNTY, ROOM, ROUTE, SALES REGION, SCHOOL ZONE, PROVINCE, STORAGE BIN, VOTER DISTRICT, WAREHOUSE ZONE
Entities and Entity Classes or Groups • Entities of a given type are grouped into an entity class • Thus, the EMPLOYEE entity class is the collection of all EMPLOYEE entities • Entity classes are described by their structure • An instance of an entity is the representation of a particular entity such as Customer 1234 and is described by its values of the attributes • Name entities with nouns that describe above (singular) INVOICE • Instances of the entity are referred to in the plural - Invoices
Attributes • Data attributes are characteristics that are common to all or most all instances of a particular entity. • Synonyms include: properties, data elements, descriptors, and fields • Attributes take on values for each occurrence of an entity. An attribute must have more than one legitimate value otherwise it is a constant.
Identifier • Identifier is an attribute or combination of attributes that uniquely identifies one, and only one occurrence of an entity. • Synonyms include key or primary key • For example, Employee instances could be identified by a SocialInsuranceNumber, EmployeeNumber or EmployeeName • Identifiers of an entity instance consists of one or more of the entity’s attributes • An identifier may be either unique or non-unique • Identifiers that consist of two or more attributes are called composite identifiers
Relationships • Entities can be associated with one another in relationships. • A relationship can include many entities; and the number of entities in a relationship is a degree of the relationship. • Degree 2 relationships are common and are called binary relationships • 1:1 one to one AUTO-ASSIGNMENT • 1:N one to many DORM-OCCUPANT • N:M many to many STUDENT-CLUB
FATHER MOTHER SALESPERSON PARENT SP-ORDER CHILD ORDER Degree 3 Degree 2 Relationship Degree
EMPLOYEE AUTO may or may not 1:1 AUTO-ASSIGNMENT must exist DORMITORY STUDENT 1:N DORM-OCCUPANT Shows MAXIMUM cardinality N:M STUDENT CLUB STUDENT-CLUB Three Types of Binary Relationships These are often called HAS A relationships
Minimum cardinality DORMITORY STUDENT 1:N DORM-OCCUPANT Recursive relationship 1:N STUDENT ROOMS-WITH Other relationships Weak Relationships EMPLOYEE DEPENDENT 1:N ID Dependententity BUILDING APARTMENT 1:N
SALESPERSON CUSTOMER N:1 I:N SALES-ORDER I:N LINEITEM I:N ITEM ERD: Semantic Object Model (SALSA)
(Customer#, CustomerName, Street, City, State, Zip) CUSTOMER SALESPERSON (SalesPerson#,SalesPersonName) ITEM (Item#, Name, Description) SALES-ORDER (Order#, Date, [Customer#], [SalesPerson#],Subtotal, Tax, Total) (LineItem#, [Order#],Quantity, [Item#], ExtendedPrice) ITEMS-ORDERED REAL Diagram (1,1) Product-Item (Resource) Customer(Agent) (0,*) (0,*) (1,1) Take Order (Event) (0,*) SalesPerson (Agent) (1,*) List Items Ordered (Event) (1,1) (0,*)
Exhibit 4-8 Recursive Relationship Example manages Employee Employee manages
Relationships • Described by verbs or verb phrases • Multiple relationships are possible between two entities Is Being Taken by COURSE STUDENT Was Taken by
Ordinality • Defines whether the relationship between entities is mandatory or optional. • Ordinality determines the minimum number of occurrences of one entity relative to another. • Ordinality must be defined in both directions
Contains Cardinality • Defines the maximum number of occurrences of one entity for a single occurrence of the related entity • This is the number to the right of the colon below. Ordinality is the number to the left of the colon. 0:M Order Products Customer 1:1 0:M Places 1:M
Relationships That Can Be Described by Data • Normally relationships are not described by data attributes • However if Cardinality is many in both directions, the relationship itself is frequently described by data attributes. • “Many to Many” relationship • An associative entity is a data entity whose attributes describe a relationship between two or more fundamental entities
Many to Many Service Shipment IsPlacedFor 0:M Requested Service 1:M 0:M 1:1 OR Order AND 1:1 1:M Is Placed For Ordered Product 0:M 0:M Product Invoice
Linking Objects with Many to Many (*:*) Relationships Create a separate table that includes the key attributes from both object tables.
Linking Objects with One to One (1:1) Relationships Create a separate table that includes the key attributes from both objects Put the key attribute of either object in the table of the other OR When you are linking two events with a 1:1 relationship, either put the key of the prior event table into the subsequent event table or create a third table.
Linking Objects with One to Many (1:*) or Many to One (*:1) Relationships Post the key attribute of the object with the 1 side of the cardinality into the table of the many (*) side of the cardinality. If you follow the specified rule and find that you would post the key of the event that occurs second into the table of the event that occurs first, create a separate table that includes the key attributes from both event tables.