Download
1 / 6
60 likes | 207 Views
Using Interactive Charting. Gaussian Output, ADF Output, Vasprun.xml files. Selecting Interactive Charting. CheckBox for Interactive Charting should be selected. To select available properties to chart use left mouse button.

E N D
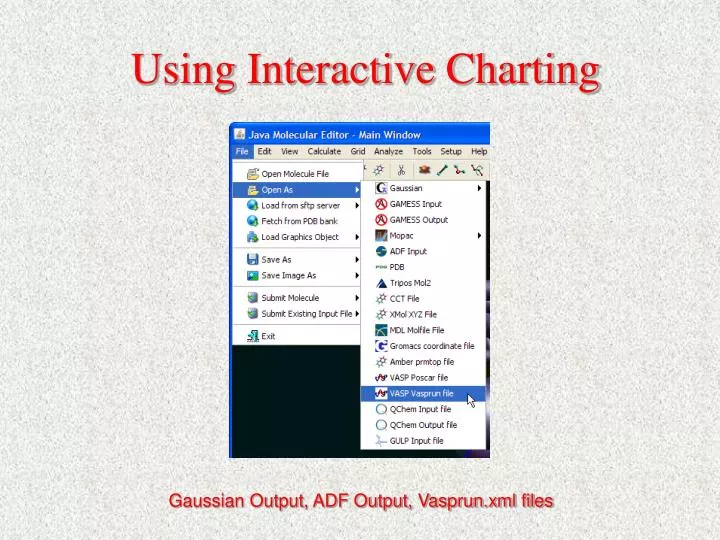
Using Interactive Charting Gaussian Output, ADF Output, Vasprun.xml files
Selecting Interactive Charting CheckBox for Interactive Charting should be selected To select available properties to chart use left mouse button To select multiple terms to chart use left mouse button and hold down Shift or Ctrl key
Charting Multiple Terms Selection of multiple terms will produce a chart with several Y-Axes
To visualize snapshots use several methods Left-mouse click in the plot area Crosshair shows current snapshot Drag slider Use animation controls Table shows current, previous and next values for the total energy
Chart Controls To save chart as a PNG image To print chart Point cursor on the plot area and do right-mouse-click
Chart Controls: Properties Dialog Using Chart Properties dialog user can change title, label and other parameters of the chart