Download
1 / 53
540 likes | 710 Views
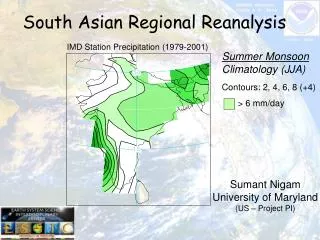
South Asian Regional Reanalysis (SARR). Ashish Routray National Centre for Medium Range Weather Forecasting (NCMRWF) Ministry of Earth Sciences Government of India. Motivation for South Asian Regional Reanalysis

E N D
South Asian Regional Reanalysis (SARR) Ashish Routray National Centre for Medium Range Weather Forecasting (NCMRWF) Ministry of Earth Sciences Government of India
Motivation for South Asian Regional Reanalysis Due to the direct societal impacts, interest in Regional Hydroclimate (precipitation, surface temperature, soil moisture, stream flow, drought indices, etc.) is intense and growing. National Action Plan on Climate Change Government of India Prime Minister’s Council on Climate Change 3.8.2 ……. Regional data reanalysis projects should be encouraged. ……..
South Asian Regional Reanalysis (SARR) A Collaborative Project between Ministry of Earth Sciences, Government of India and National Oceanic and Atmospheric Administration, Department of Commerce, United States of America
Specific SARR Goals Refinement in methods of precipitation and radiances assimilation. Conduct a 5-year pilot-phase reanalysis (to test and optimize data stream organization and the geographic domain and assimilating model choices) Develop high-resolution SST analysis for the Indian ocean from satellite and in-situ observations, including moorings, drifters and Argo floats Design techniques for assimilation of aerosols Generate a high spatio-temporal resolution (≤25 Km, ≤3 hours) climate data set for the 1979-2009 period over the South Asian land-ocean region.
Responsibilities of the Parties NOAA agrees to: Provide MoES full access to the archived observations used in the global reanalysis projects. Provide technical help, training, and guidance in organization of data streams and in the implementation of the regional reanalysis model. Provide training to MoES scientists in regional reanalysis techniques and procedures during 6-8 week annual visits to US institutions and NOAA laboratories. Share the NCEP data processing and quality control procedures during reanalysis project with MoES scientists. Support travel of NOAA and US university scientists to India in connection with SARR project activities.
MoES agrees to: • Provide NOAA full access to all historical and current meteorological observations as per requirement of the project over the Indian subcontinent and Indian Ocean, including those from Indian satellites. • Execute the South Asian Regional Reanalysis project through NCMRWF. • Provide full-time modeling scientists to develop, implement, and test numerical codes. • Provide 4-6 full time Ph.D. scientists to design, test, and implement various assimilation schemes in the numerical model. • Provide high-speed mainframe computer resources for execution of this computationally intensive project. • Provide storage devices and skilled manpower (data management specialists) to organize data streams, data archival, data dissemination, and webpage design and maintenance. • Provide continuous high-speed internet access to project scientists, including visiting ones. • Provide lodging and boarding for visiting US project scientists.
Exchange visits • NOAA will provide training to 2-3 MoES scientists in regional reanalysis techniques and procedures during 6-8 week annual visits to the University of Maryland and NOAA's National Centers for Environmental Prediction (NCEP). • NCEP will seek resources and assistance from NOAA's International Activities office in meeting its responsibilities. • NOAA and MoES scientists will meet yearly to discuss the project's progress, and to strategize on how to best accomplish the project goals. • NOAA and MoES will separately cover travel costs associated with exchange visits for their respective technical and scientific personnel.
Milestones SARR IA signed in September 2008 in New Delhi 1st Annual Review by JEM held in October 2009 in New Delhi Functional Group created at NCMRWF for SARR in November 2009 SARR Scoping Workshop held in New Delhi in February 2010 2nd Annual Review by JEM held in October 2010 in Washington DC
The SARR Project is being carried out with an objective that the SARR Products shall be useful for Climate Diagnostics, Climate Variability, Climate Change, Model Verification/Tuning It is expected that The SARR project will provide an Atmosphere-Land-Ocean surface state description where consistency between circulation and hydroclimate components is assured. To achieve the goal, assimilation of rainfall, radiance, and aerosol observations in numerical weather prediction models shall be carried out
SARR Project Team at NCMRWF Sarat C. KarProject Management Ashish RoutrayAssimilation- Lead Prashant Mali Modeling- Lead Jaganabdhu Panda Modeling (worked for about 3 months and left in September 2010) K. Sowjanya Assimilation (worked for about 1 year and left in September 2011) Sapna Rana Diagnostics (worked for about 1 year and left in November 2011)
Domain chosen for SARR Lat: 150S-450N (286 pts) Lon: 400E-1200E (332 pts) Res.: 25 km (pilot phase) 18 km (final SARR) Cen-lat: 17.50N Cen-lon: 80.00E
NCEP SARR OBSERVATION DATA BANK IMD NCMRWF Countries in SARR domain INCOIS ISRO Field Experiments
DATA from FIELD EXPERIMENTS Land Surface Processes Experiment (LASPEX) C T C Z BOBMEX ARMEX PROWNM C B STORM Programme
SARR Scoping Workshop held in New Delhi, India (February 10-11, 2010) 9 scientists from USA and about 20 scientists from India participated. Analysis method and the model as well as domain of analysis finalized. WRF model (3.1 version) and WRF-3DVar shall be used to carry out SARR Pilot phase. The Workshop recommended an implementation strategy for success of the SARR project.
Work plan at NCEP • Training on methodology for assimilation of the radiance data (mainly the older period radiance data) using the GSI system so that a similar technique can be developed later for the WRF-3DVAR analysis system. • As part of the training, experiments using radiance data assimilation for Indian summer monsoon seasons (mainly for older period) using the NCEP GSI system and document impact assessment. • Familiarization with the available diagnosis package for monitoring and for calculation of statistics of the radiance data utilized in the assimilation cycle.
SARR Pilot Phase Experiments (1999-2003)
Analysis Scheme & Model for SARR Pilot Phase WRF 3.1 and WRF-VAR (3.1) has been chosen for SARR Pilot phase experiments Several modeling and assimilation experiments have been carried out using past data. Most of the experiments are for July 1999 using NCEP & NCMRWF observation datasets
Challenging regions for obs. data Sound Av. Number of TEMP observation per day reaching particular height in July 1999 Average Number of Observations per day in July 1999 Blocks- 42 and 43
Mean RMSE of wind components from different observations at model initial time
Mean RMSE of OBS-FG Mean RMSE of OBS-ANA SARR Test runs with NCEP & NCMRWF data
SARR Pilot Phase Experiments (i) with various Physics Options Dynamic Downscaling using WRF (ii) with various Physics Options Assimilation using WRF & WRF-VAR Most of the experiments are for July 1999 using NCEP & NCMRWF observation datasets
SARR Pilot Phase Sensitivity Experiments All Experiments were done for July 01- 31 1999. With Assimilation- Cyclic, Four times a day (6-hourly) No Assimilation- only Model run Four-times a day (6-hourly). (Similar to downscaling experiments) Precipitation in July 1999 CMAP, TRMM (3B42) and IMD Observed Rain
Precipitation from Global Reanalysis datasets for July 1999 As can be seen, the global reanalysis has failed to bring out details of rainfall distribution over India and higher rainfall amounts are placed at incorrect locations
SARR Pilot phase Sensitivity Experiments No Assimilation With Assimilation
It has been shown that just downscaling of coarse resolution global reanalysis (No Assimilation runs) is not sufficient for accurate representation of the Indian monsoon hydroclimate. When regional assimilation is carried out, such representation is improved.
SARR Pilot Phase Sensitivity Experiments Experiments have been carried out using ISRO derived vegetation data instead of USGS climatological vegetation available with the WRF model. Results indicate that hydroclimate representation over India is sensitive to such specifications.
Impact of Field phase Experiments- BOBMEX data Bay of Bengal Monsoon Experiment (BOBMEX) July-August 1999
Impact of Field phase Experiments- BOBMEX data (00Z 12 August 1999) Assim- Control Assim- with BOBMEX Difference
Parallel Assimilation from May 2001 to Sept 2001. Need of Overlapping period U at 850hPa Pilot phase Assimilation with conventional data has been completed from 1999-2003. Assimilation with Radiance data and conventional data is being carried out for the same period. Parallel run period is also being extended. T at 850hPa
Comparison between CFSR, SARR and Observation (1-31 July 2000) OBS CFSR SARR
SARR Production Runs Five simultaneous Streams • Jan. 1979 - Dec. 1985 7 years • Apr. 1985 - Dec. 1991 7 years • Apr. 1991 - Dec. 1997 7 years • Apr. 1997 - Dec. 2003 7 years • Apr. 2003 - Dec. 2009 7 years 9-month overlap for each stream Total 35 years of Reanalysis Computation
SARR Products Archival and Distribution Archival Format (Reanalysis): IEEE (suitable for GrADS) NetCDF GRIB2 Archival Format (Observed data): ASCII (GTS) PrepBUFR little-R Original format of data Archival online/nearline disk, Tapes Available to Partner Organizations: Immediately
SARR – What next? SARR -II After the successful completion of SARR’s present project, We propose to carryout SARR-60 SARR-60 From 1950 to 2009 at 9 km resolution Regional Ocean-Atmosphere coupling - shall be the comprehensive dataset for climate studies in South Asia.
Numerical Experiments The objective of the study is to evaluate the impact of the different back ground errors (Global and Regional) towards simulation of four Monsoon Depressions (MDs) over Indian region during SARR pilot phase period. 27-29 July 1999 (Case-1) 17-18 June 1999 (Case-2) 11-12 June 1999 (Case-3) 6-8 August 1999 (Case-4) For this purpose three numerical experiments are carried with WRF-3DVAR as follows: CNTL: Without data assimilation using NCEP re- analyses as IC and BC. BG-3DV: Data assimilation using NCEP global Background Error (BE). 3) BR-3DV: Data assimilation using own calculated BE over SARR region. The additional observations viz. SYNOP, SHIP, TEMP, BUOYS, PILOT, GEOMV, AIREP etc. are used to improve the model initial condition derived from coarse resolution large scale global analysis.
b) a) c) Mean RMSE from BR-3DV and BG-3DV of O-A for a) U (m/s), b) V (m/s) and c) T (K).
BG-3DV ANA NCEP ANA BR-3DV ANA OBS: 21.0/89.0 CNTL:21.8/89.8 BG-3DV:21.6/88.8 BR-3DV:20.8/89.5 Case-2 OBS:18.5/86.0 CNTL:18.5/87.0 BG-3DV:18.9/87.1 BR-3DV:19.2/86.5 BG-3DV ANA BR-3DV ANA NCEP ANA Case-1 Model Initial time wind fields at 850 hPa and MSLP
Case-1 Case-2
Case-3 Case-4
Spatial RMSE (mm) and Correlation Co-efficient (CC) of rainfall over the area (Lat=150-250N; Lon=750-900E) for all cases.
Temperature (oC) at 850 hPa GTS+Rad GTS Diff. (Rad-GTS)
Wind (m/s) at 850 hPa GTS+Rad GTS Diff. (Rad-GTS)
GTS+Rad GTS Diff. (Rad-GTS) Wind (m/s) at 500 hPa