Download
1 / 18
180 likes | 318 Views
Overview of the GCE Data Toolbox for MATLAB. Wade Sheldon Georgia Coastal Ecosystems LTER University of Georgia. Background & Motivation. Georgia Coastal Ecosystems LTER project started in Sept 2000

E N D
Overview of the GCE Data Toolboxfor MATLAB Wade Sheldon Georgia Coastal Ecosystems LTER University of Georgia
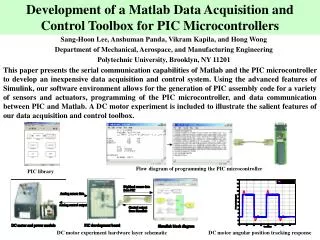
Background & Motivation • Georgia Coastal Ecosystems LTER project started in Sept 2000 • Large data collection effort (cruises, moorings, met stations, water quality, field surveys, ...) • NSF & LTER require data archiving and sharing • LTER requires detailed “metadata” for every data set • Needed to standardize data processing, quality control, documentation • No ready-to-use software for LTER data management • Lab management software (LIMS) useless for field data, expensive • Most LTER sites were using “flat files” – limiting • A few sites using relational databases, client/server apps – proprietary, complex, unfamiliar, require constant network access • Chose to develop custom data management software (MATLAB) • Experienced using MATLAB for automating data processing, GUIs • Better code-reuse potential than database/web solution • Best compromise: file-based but supports fully dynamic operations
What is MATLAB? • From Mathworks: (http://www.mathworks.com/products/matlab/) "MATLAB is a programming environment for algorithm development, data analysis, visualization, and numerical computation. Using MATLAB, you can solve technical computing problems faster than with traditional programming languages, such as C, C++, and Fortran." • Benefits: • Ubiquitous in engineering and many science branches • Geophysics, Oceanography, Chemistry, ecological modeling, sensor networking • Rapid development with lots of pre-built functionality, Java integration • Cross-platform code, GUIs and data formats (Windows, *nix, Mac OS/x) • Stable: good support and backward compatibility (28 year history) • Scalable (netbook to cluster) - great performance with huge data sets • Broad I/O support (serial ports to web services) • Drawbacks: • Commercial ("licensed source") – limits flexibility, costs $-$$$ • Some programming required for maximum use
Toolbox Development • Started by reviewing ESA’s “FLED” report • Gross, Katherine L. and Catherine E. Pake. 1995. Final report of the Ecological Society of America Committee on the Future of Long-term Ecological Data (FLED). Volume I: Text of the Report. The Ecological Society of America, Washington, D.C. • Identified information storage requirements • Any number of numeric (integer, float, exponential) and text variables • Structured attribute metadata for each variable (name, units, desc., type, precision, ...) • Structured documentation (dataset metadata) for dynamic updating, formatting • Versioning and processing history info (lineage) • Quality control rules for every variable, qualifier flags for every value • Designed data model: “GCE Data Structure” • MATLAB “struct” array with named fields for each class of information • Detailed specifications for allowed content in each field • “Virtual table” design based on matched arrays for linking attribute metadata, data, flags • Same philosophy as relational database table plus additional descriptors
Toolbox Development • Developed MATLAB software library to work with data structures • Utility functions to abstract low-level operations (API) • Create structure, add/delete columns, copy/delete rows • Extract, sort, query, update data, update flags • Analytical functions for high-level operations • Statistics, visualizations, geographic & date/time transformations • Unit inter-conversions, aggregation/re-sampling, joining data sets • GUI interface functions to simplify using the toolbox • All functions use metadata, data introspection to auto-parameterize and automate operations (semantic processing) • Developed indexing and search support (and GUI search engine)
Toolbox History • 2001 – Initial toolbox development in Feb 2001 (revised in May to add dynamic QA/QC) • 2002 – Added GUI, released code to GCE affiliates • 2003 – Added dynamic data harvesting support (USGS, NOAA, CSI LoggerNet); automated USGS harvesting service for ClimDB/HydroDB • 2004 – Added "search engine" tool for local search/integration of data • 2005 – First public distribution of "compiled" code; source code on request to LTER sites • 2006 – Added ClimDB data mining GUI • 2007 – Added enhanced data sythesis, refactoring tools • 2008 – Added GUI for managing QA/QC rules in metadata templates, additional flag tools • 2009 – Refined XML schema for formatted metadata; code moved to SVN • 2010 – Toolbox released as open source (GPLv3); Trac support site established • 2011 – Expanded QA/QC tool options, refinements; focused on usability • 2012 – Added prototype EML support, GUI for batch processing (import/export)
Suitability for Real-Time Sensor Data • Good Scalability • Data volumes only limited by computer memory (tested >2 GB data sets) • Multiple instances can be run on high-end, 64bit, clustered workstations • Good flag evaluation performance in use, testing with diverse rule sets • Good scope for automation • Command-line API for unattended batch processing via workflow scripts • Timed and triggered workflow implementations easy to deploy • Support for multiple I/O formats, transport protocols • Formats: ASCII, MATLAB, SQL, specialized (CSI, SBE, NWIS RDB, HADS, …) • Transport: local file system, UNC paths, HTTP, FTP, SOAP • Already used for real-time GCE data, USGS data harvesting service (LTER HydroDB, CWT)
Implementation Scenarios • End-to-End Processing (logger-to-scientist) • Acquire raw data from logger, file system, network (CIFS,HTTP,FTP,SOAP) • Assign metadata from template or using forms to validate and flag data • Review data and fine-tune flag assignments • Generate distribution files & plots, archive data, index for searching • Scientists can use toolbox on their desktop • Data Pre-processing • Acquire, validate and flag raw data (on demand or timed/triggered) • Upload processed data files (e.g. csv) or value & flag arrays to RDBMS (e.g HIS) • Workflow Step • Call toolbox from other software as part of workflow (e.g. LoggerNet) • Kepler via MATLAB actor • DataTurbine via MATLAB off-ramp or Java API
Concluding Remarks • “Fine Print” • Requires MATLAB ($ academic, $$$ government/industry) • Software documented, but more tutorial and training materials needed (planned) • Support is limited (unfunded outreach) • Benefits • Fully cross-platform (Windows, MacOS, Linux, Solaris) • Mature – used 24/7 for over 11 years for LTER data management (>3000 dl's) • GCE Data Toolbox is free and open source (GPL) – can customize, redistribute • More information and downloads at:https://gce-svn.marsci.uga.edu/trac/GCE_Toolbox (This work was supported by NSF grants OCE-9982133 and OCE-0620959)
Interactive Demo & Discussion • Installing and launching the GCE Data Toolbox • Loading data • Pre-defined import filter and metadata template • Generic text file and new metadata template • Performing QA/QC • Defining and editing "rules" • Interactive QA/QC flag visualization, revision • Managing flagged values • Post-processing data • Filtering, basic gap filling, drift correction • Statistical re-sampling, binning • Integrating multiple data sets • Batch processing & export