Download
1 / 45
450 likes | 644 Views
ECOSYSTEM JELLO…. Kerim Aydin Bob Francis Pat Livingston. Ecosystem properties. “Stability” Many Many terms Resilience Resistance Food web structure? Diversity High biomass or other adaptations in susceptible groups MEASURE VARIANCE. Need to understand control. TOP DOWN? BOTTOM UP?

E N D
ECOSYSTEM JELLO… Kerim Aydin Bob Francis Pat Livingston
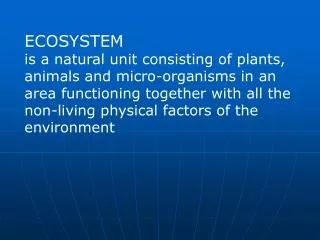
Ecosystem properties • “Stability” Many Many terms • Resilience • Resistance • Food web structure? • Diversity • High biomass or other adaptations in susceptible groups • MEASURE VARIANCE
Need to understand control • TOP DOWN? • BOTTOM UP? • MIDDLE OUT? • Which (if any) is dominant in marine systems?? • Explanations may be easy to find and hard to confirm!
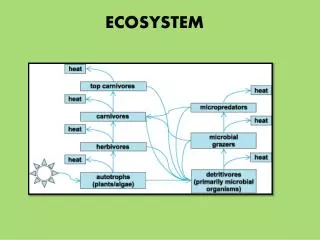
“Kitchellization” Marine Mammals Sharks • The process of losing beer money by making poor guesses about ecosystem responses Large Fish ??? Forage Fish Zooplankton Phytoplankton
“Revenge??” Marine Mammals Sharks Large Fish Forage Fish Zooplankton Phytoplankton
Top-down-bottom-up-ENSO-PDO-fishing? Figure the Frequency!!!
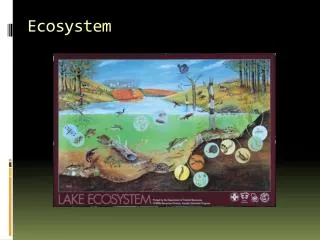
Where can you go from a marine food web? • Process models • Investigate specific environmental linkages • Address species concerns (endangered spp.) Food Webs • Multi-species harvest models • Predict returns from harvest strategies • Biomass dynamics models • Measure broad ecosystem properties • Assess risks of regime shifts • Determine the need for mechanisms
Why use the most general models?Regimes Happen! • Biomass dynamics models • Measure broad ecosystem properties • Assess risks of regime shifts • Determine the need for mechanisms • There needs to be a way to abstract ecosystems, and look for risks. • This is one example of using “whole ecosystem properties” to examine this risk.
Food web forcing? Marine Mammals Sharks Large Fish ???? Forage Fish Zooplankton Phytoplankton
Variation comes with history • This is maybe not so important in labs and lakes (“white” systems). • But in large marine systems….
History vs. the correlation method - equilib. Vs. time... • TOP DOWN OR BOTTOM UP???
How can variability vary? • Amplitude • Frequency • Cadence
What are the characteristics of a food web component? • Biomass (“tons”) • Production (“tons/year”) • P/B (1/year)- • inverse of replacement time • related to generation time B P P/B
What are the characteristics of a food web component? • Biomass (“tons”) • Production (“tons/year”) • P/B (1/year) • Trophic level B P P/B
What are the characteristics of a food web component? • Biomass (“tons”) • Production (“tons/year”) • P/B (1/year) • Trophic level • Network characteristics • Dissipative characteristics B P P/B
B vs. P/B P • R vs. K selected... P B B P/B P/B
This experiment • Start with two “Actual” Food Webs • The East. Bering Sea • Shelf system with pollock • as the dominant fished species • The East. Tropical Pacific • Tuna are dominant fished species • Both have shown interannual variation in primary production • which may be linked to climate signals.
Need rules for species interactions ???? • One possibility of many: • P/B then B of predator respond to increases of prey biomass • “overly stable” - only looking for chances of regimes • Ratio-dependent predator/prey model with satiation (ECOSIM based) • Mimics surplus production (Pella-Tomlinson) model when predator, prey fixed. • Next step is to add better age-structure (single biggest weakness of the model).
Dynamics of overlap “It’s cold down there!” V Bj B-V aijVijBj vij (Bi-Vij) Vij Bi - Vij Assume fast equilibrium for Vij vijVij dVij /dt= vij(Bi-Vij) - vijVij - aijVijBj
The appearance of Density Dependence • dVij /dt= vij(Bi-Vij) - vijVij - aijVijBj = 0 • Vij = vijBi/(2* vij + aijBj) • Cij (Bi,Bj) = aijvijBiBj (2* vij + aijBj) Prey biomass Cij (or Minstant) Cij /Bj Predator Biomass
P/B vs. Trophic Level - EBS • (note missing microzooplankton) • B vs. Trophic Level? No firm relationship…
Insert bottom up variation • Use “natural” signal (e.g. ENSO)
Insert bottom up variation • Use “natural” signal (e.g. ENSO) • Vary amplitude, frequency, cadence
Insert bottom up variation • Use “natural” signal (e.g. ENSO) • Vary amplitude, frequency, cadence
Insert bottom up variation • Use “natural” signal (e.g. ENSO) • Vary amplitude, frequency, cadence
Results • Here’s a couple 100-year time tracks... • We care about: • Amount of variability transmitted (CV over 100 years)
Amplitude and cadence • Increasing the amplitude of forcing increases the amplitude of response. • Cadence is complex, and depends too heavily on (unknown) parameters.
One theoretical explanation... • Simply hitting the resonant frequencies of each model component? • Useful for model (and real life) analysis of important terms. • “Real life” P/B values may imply natural resonant frequencies.
Small observations • Missing seasonal/micronekton • Frequencies, P/B are the same unit (1/time) • Trophic Level less of a fit
Fish must follow history or be history • If P/B of a species is in the range that it is “excited” by the balance of top-down/bottom up, does it need extra biomass to be stable (“avoid” regimes)? • We don’t know the frequency of primary production variation in many systems. • Need to look at more ecosystems
What responds to each frequency range? • Forage fish, micronekton response peaks near ENSO-scale forcing. • This doesn’t mean that they vary on an ENSO scale, but that they are most susceptible to crashes when the bottom-up forcing is at that scale.
What responds to each frequency range? • Forage fish, micronekton response peaks near ENSO-scale forcing. • Larger commercial fish response peaks at “regime” (10-50 year) forcing.
So what about fishing? • General principle of surplus production As B goes down, P/B goes up, due to: • more food per fish • smaller, faster growing fish P P B B P/B P/B
Are our fish becoming anchovies? • Beyond “multispecies MSY”, have we changed the natural time scale of animals (P/B, replacement, generation time) without changing the natural time scale (frequency) of input variation?
Shift happens (with a little help from…) • Fishing may push a species in or out of the high CV range. • Will regime changes occur MORE or LESS frequently with fishing? • It can occur in both directions: the fin whale control? • What is the range of fishing change compared to natural variability in P/B?
Preliminary until... • More ecosystems and parameters • Devil in the details • Model type, (L.V., ECOSIM, Spatial, parameters) • Fishing changes (historical) • Still, true for “reasonable” forms • Middle-out Forcing
CONCLUSIONS • The frequency of primary production variation may be strongly connected to P/B. • The frequency associated with regime shifts (10-50 year period) is the frequency at which most currently fished species show the strongest response. • Fishing may push P/B into or out of the range of greatest variation, depending on the frequency of natural forcing in the ecosystem.