Download
1 / 52
520 likes | 696 Views
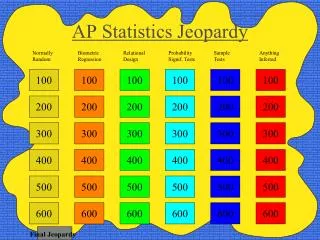
Scatter Plots and Statistics Jeopardy!. Fix With RLS (100). Carra wants to know how many students at Wheeler eat packed lunches, so she asks 500 people at the grocery store. Address what she should fix with RLS. Answer Home. Fix With RLS (100) ANSWER.

E N D
Fix With RLS (100) Carra wants to know how many students at Wheeler eat packed lunches, so she asks 500 people at the grocery store. Address what she should fix with RLS. AnswerHome
Fix With RLS (100) ANSWER • R-it is currently random, but she wants to know about Wheeler students, so she should ask at Wheeler • L-she did ask a large sample size • S-She should ask at Wheeler, not the grocery store. BackHome
Fix With RLS (200) • Kayla wants to know how many of her classmates play at least 3 hours of video games a night, so she asks her 10 friends on Kanikapila how many hours they play. Address what she should fix with RLS AnswerHome
Fix With RLS (200) ANSWER • (R ) People she asked weren’t random • (L) Asked very few people • (S) Asked at Kanikapila practice. These students probably play less video games because they sing after school BackHome
Fix With RLS (300) • Abra wants to know how many people have gages. Which situation will provide the MOST bias? • (A) asking every 3rd person at the grocery store • (B) asking every 3rd person at a jewelry parlor • (C) asking every 5th person at school • (D) asking every 5th person at a library Answer Home
Fix With RLS (300) ANSWER • (B) asking every 3rd person at a jewelry parlor BackHome
Fix With RLS (400) • Leila wants to know how many middle school students want to have a longer recess. What situation will provide the LEAST bias? (A) asking students who are tardy after recess (B) asking all 8th graders (C) asking every 3rd classmate (D) asking every 2nd person to come to school AnswerHome
Fix With RLS (400) ANSWER • (D) asking every 2nd person to come to school Back Home
Fix With RLS (500) • Design a way to measure how many students in the 8th grade eat peanut butter and jelly sandwiches for lunch. AnswerHome
Fix With RLS (500) ANSWER • Answers will vary • Example: • (R) ask every 3rd eighth grader to show up for school • (L) ask the entire 8th grade population • (S) ask at Wheeler BackHome
What’s Misleading? (100) Home Answer
What’s Misleading? (100)ANSWER • The size of the picture of the animals are very different, so even though each picture means 50, it looks like more people own horses than any other animal. Back Home
What’s Misleading? (200) AnswerHome
What’s Misleading? (200)Answer • Although the vertical scale starts at 0, it does not go up in even steps. This distorts the graph, and makes it look as though the biggest jump is between 1 and 2, rather than 3 and 4. • Also, there are no labels on the axes, so we have no idea what this graph represents! Back Home
What’s Misleading? (300) AnswerHome
What’s Misleading? (300)ANSWER • From this graph, it looks as though house prices have tripled in one year! It is misleading because the vertical axis does not start at 0. BackHome
What’s Misleading? (400) AnswerHome
What’s Misleading? (400)ANSWER • There is no scale on the vertical axis and, because of the perspective, it looks as though sales for 1995 were far greater than those for any other year. In fact, they were identical to those in 1997. BackHome
What’s Misleading? (500) AnswerHome
What’s Misleading? (500) ANSWER • The cars, trucks and semis are all different sizes, so it looks like there are more trucks and semis than there are. Back Home
Predict the Future Value (100) Predict the value of the German Mark if the French Mark is at 100. AnswerHome
Predict the Future Value (100) Answer • Around 105 • (100, 105) • Acceptable answers 100 – 120 BackHome
Predict the Future Value (200) Predict the hours of sleep if you drink 10 cups of coffee. AnswerHome
Predict the Future Value (200) ANSWER • Around 1.5 • (10, 1.5) • Acceptable Answers between 1 and 2. Back Home
Predict the Future Value (300) • Line of best fit: y = 3x – 35 • Predict the y value when x is 14. Answer Home
Predict the Future Value (300) ANSWER • y = 7 • (14, 7) Back Home
Predict the Future Value (400) • Slope: 2 • Y-intercept: -28 • Predict the value of y when x is 45 Answer Home
Predict the Future Value (400) ANSWER • 62 • (45, 62) • Line of best fit: y = 2x – 28 Back Home
Predict the Future Value (500) • The line of best fit goes through the points (3, 9) and (12, 27). • Predict the value of y when x is 15. Answer Home
Predict the Future Value (500) ANSWER • 33 • (15, 33) • Line of best fit: y = 2x + 3 BackHome
Line of Best Fit (100) Is y = .5x + 2.75 a good estimate for this line? AnswerHome
Line of Best Fit (100) ANSWER • No, the slope matches, but the y-intercept is slightly too high. BackHome
Line of Best Fit (200) • Is this a good line of best fit? AnswerHome
Line of Best Fit (200) ANSWER • No, the data is not spread above and below the line evenly • Cannot use the line to estimate where most points will fall on the line. Back Home
Line of Best Fit (300) • What type of correlation would you expect to see if you were measuring the number of cats (x) vs. the number of mice (y) in a farmer’s barn? Answer Home
Line of Best Fit (300) ANSWER • Negative correlation. As the number of cats increases (x) the number of mice in the barn (y) will decrease. BackHome
Line of Best Fit (400) • A line of best fit goes through the points (4, 18) and (12, 34). What is the equation of the line of best fit? Answer Home
Line of Best Fit (400) ANSWER • Y = 2x + 10 BackHome
Line of Best Fit (500) • A line of best fit goes through the points (7, 11) and (2, -5). What is the equation of the line of best fit? AnswerHome
Line of Best Fit (500) ANSWER • Y = 3.2x – 11.4 BackHome
Trends and Outliers (100) Describe the correlation seen in the graph to the left. AnswerHome
Trends and Outliers (100)ANSWER • Positive correlation • Can’t be “no correlation” because they follow an upward pattern and there are no values in the lower right to suggest no connection. BackHome
Trends and Outliers (200) • Are there any outliers? If so, identify them by location. If not, explain how you know. Answer Home
Trends and Outliers (200) ANSWER • There are no outliers. The data is tightly clustered around the line.
Trends and Outliers (300) • Which graph shows the relationship between a dog’s age and how fast it can run? AnswerHome
Trends and Outliers (300) ANSWER • C • As the dog gets older, it can’t run as fast. BackHome
Trends and Outliers (400) • Could I describe the relationship in this graph as “the fewer years you work, the less income you make”? AnswerHome
Trends and Outliers (400) ANSWER • YES • Remember, the word “less” is tricky. Avoid it to avoid making mistakes. BackHome