Download
1 / 20
200 likes | 331 Views
CCA Threshold Levels. Authors:. Date: 2011-01-17. Authors:. Summary. We present system simulation results to determine and propose the CCA levels on secondary 20/40/80MHz channels Two sets of different simulations are presented The first set assumes that all STAs are sharing same bandwidth

E N D
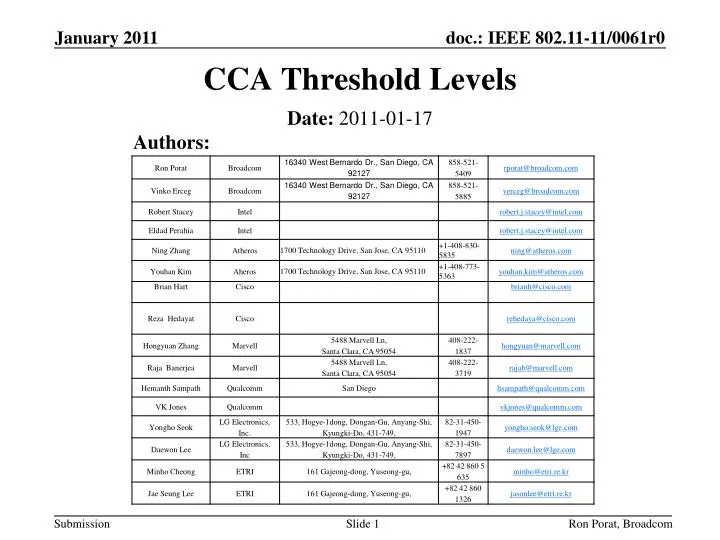
CCA Threshold Levels Authors: Date: 2011-01-17 Ron Porat, Broadcom
Authors: Ron Porat, Broadcom
Summary • We present system simulation results to determine and propose the CCA levels on secondary 20/40/80MHz channels • Two sets of different simulations are presented • The first set assumes that all STAs are sharing same bandwidth • The second set assumes that STAs share a mix of 40MHz and 80MHz bandwidths Slide 3 Ron Porat, Broadcom
System Simulation Parameters – First Set • N APs and M STA per AP are dropped in an area of size SxS ft (numbers shown in plots) • APs are placed regularly with 5ft std (results with 15ft are similar) • STAs are associated with the closest AP according to path loss (including random shadowing) • One valid transmission per BSS is assumed • BSSs are chosen randomly that meet CCA rules (50% probability to choose an AP as a transmitter) • After all transmitters were chosen, SINR is calculated at each receiver and mapped to MCS • SISO links over one 40MHz channel are assumed with 15dBm transmit power • CCA levels are varied from -90dBm to -50dBm (-90dBm just above noise floor for 40MHz) • Simulation uses 50 drops and 250 TXOP per drop • All plots show average and five percentile per-link throughput (Tput) , average and five percentile sum Tput in TXOP, and the number of concurrent transmissions Slide 4 Ron Porat, Broadcom
A note on Performance with Multiple Frequencies • The results in this simulation assume that all BSS use the same frequency representing a worst case scenario. • If multiple frequencies are used, adjacent BSS will not cause as much interference to each other since they will be operating on different frequencies. • BSS that share the same frequency will be farther apart and will not suffer as much from increased CCA levels. Slide 5 Ron Porat, Broadcom
Result 1 – very low density (400ft x 400ft, 4 APs) • Due to the large distance between AP the individual links Tput is low. CCA levels above -75dBm achieve most of the network throughput • Optimal point maximizing network throughput at -65dBm • Optimal point maximizing per-link Tput at noise level Slide 6 Ron Porat, Broadcom
Result 2 – low density (200ft x 200ft, 4 APs) • Similar trends seen with an optimal point maximizing network throughput at -60dBm • Optimal point maximizing per-link Tput is at approximately -85dBm Slide 7 Ron Porat, Broadcom
Result 3 – high density I (200ft x 200ft, 9 APs) • Optimal point maximizing network throughput at -50dBm • Optimal point maximizing per-link Tput at noise level Slide 8 Ron Porat, Broadcom
Result 4 – high density II (300ft x 300ft, 16 APs) • High number of AP and clients enables many more transmitters to operate concurrently and maximum network throughput is achieved at CCA level -55dBm • Optimal point maximizing per-link Tput at noise level Slide 9 Ron Porat, Broadcom
Result 4 – cont. • In each drop we sum the number of times each BSS had a transmission (out of 250 x 50 TXOP) and plot the ratio relative to the average of al BSS • Low CCA level cause unfairness for inner BSS Slide 10 Ron Porat, Broadcom
System Simulation Parameters – Second Set • System-level simulations that include all the MAC behaviors would provide more insight on the interplay of PHY and MAC • VHTSTA receiver with 80 MHz operating bandwidth shall provide CCA on all 20 MHz channels constituting the 80 MHz channel. • In the following slides the CCA choices for secondary 40 MHz is investigated, and would expect equivalent CCA values to be extended to secondary 80 MHz channel Primary 40 MHz CCA threshold -79dBm Secondary 40 MHz CCA threshold TBD Ron Porat, Broadcom
System Simulation Parameters – Second Set: Cont • UDP traffic, packet size of 1500 bytes • CWmin=7, CWmax=63 • Data rate: 3/4, 64QAM • Control rate: 1/2, 16QAM • TXOP limit: 3 ms • Bandwidth 40 MHz: 108/6 data/pilots tones • Bandwidth 80 MHz: 234/8 data/pilot tones Ron Porat, Broadcom
Case I • BSS40MHz (blue) • BW=40MHz • Channel 44(P)-48 • BSS80MHz (red) • BW=80MHz • Channel 36(P)-48 APs distance ~22 m Ron Porat, Broadcom
Case I -79dBm on Secondary 40MHz APs distance ~10 m -73dBm on Secondary 40MHz -76dBm on Secondary 40MHz Ron Porat, Broadcom
Case II • BSS40MHz (blue) • BW=40MHz • Channel 36(P)-40 • BSS80MHz (red) • BW=80Mhz • Channel 36(P)-48 • BSS40MHz (green) • BW=40MHz • Channel 44(P)-48 Blue and green curves are same APs Distance ~20-30 m Ron Porat, Broadcom
Case II -79dBm on Secondary 40MHz APs Distance ~8 m -73dBm on Secondary 40MHz -76dBm on Secondary 40MHz Ron Porat, Broadcom
Conclusions from the Results • Optimal CCA levels may depend on the density of the networks and the achievable per-link throughput without interference (which is a function of the MIMO configuration, transmit power and path loss) • Higher CCA levels are preferable to maximize network throughput • Lower CCA levels are preferable to maximize single link throughput • Fairness: • High CCA levels • May result in some STAs having low per-link throughput • Link Adaptation may be important • Low CCA levels • Shut down adjacent BSS for several TXOPs even though AP and clients in that BSS have high SNR • Impact QoS since delay in channel access is increased • Fairness with mixed bandwidths needs to be taken into account Slide 17 Ron Porat, Broadcom
Conclusions from the Results: Cont • Dynamic selection of CCA levels may be optimal but more work may be needed to understand how to choose the levels • Assuming one CCA level is chosen we think a reasonable compromise is to adopt CCA levels in the middle of the range at -72 dBm for 40MHz BW adjusted proportionally for different BWs. • However, as shown in the next slide, for the case of 20 MHz secondary channels we propose a higher level of -72dBm to improve fairness with 802.11n • Note that the proposed CCA levels are 10-13 dB more stringent than the 802.11n levels Slide 18 Ron Porat, Broadcom
HT and VHT STAs in Adjacent 40MHz Channels • WiFi devices operate with an average of 25dB adjacent channel leakage • Large discrepancy in CCA level for secondary20 between 11n and 11ac may lead to unfairness between HT and VHT STAs in adjacent channels using the same bandwidth in some cases • 11n has -62 dBm CCA sensitivity for the secondary20 • There is extra incentive to reduce the discrepancy in CCA level between 11n and 11ac for secondary20 VHT STA in pink channel, HT STA in blue channel VHT STA transmitting HT STA transmitting 40 MHz 40 MHz 40 MHz 40 MHz P P S S S S P P -62 dBm -82 dBm Secondary20 of HT40 STA is IDLE Secondary20 ofVHT40 STA is BUSY Ron Porat, Broadcom
Pre motion #1 • Move to accept the following CCA levels on the secondary channels: 20MHz: - 72 dBm 40MHz: - 72 dBm 80MHz : - 69 dBm Ron Porat, Broadcom Slide 20