Download
1 / 19
190 likes | 347 Views
Powering Network Rail with the Oracle Business Intelligence Platform. Antony Brown – Head of Finance & BI Systems Network Rail. Program Agenda. Network Rail – background in brief Our Vision Where does BI fit into the mix Our data and information Our journey since last year Key learnings.

E N D
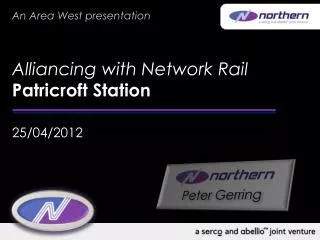
Powering Network Rail with the Oracle Business Intelligence Platform Antony Brown – Head of Finance & BI Systems Network Rail
ProgramAgenda Network Rail – background in brief Our Vision Where does BI fit into the mix Our data and information Our journey since last year Key learnings NETWORK RAIL
Helping Britain run better Run, maintain and develop Britain’s railways Building a safer, smarter, bigger, greener network – every day
A success story – we took responsibility for Britain’s Railway in 2002 Investment has enabled us to cut the cost of running the railway by 44% in the last decade at the same time as improving punctuality… Controllable operating costs per train mile (2012/13 prices) Passenger trains arriving on time … allowing over 500 million more people to get to their destination on time than when Network Rail was created Source: Network Rail Annual Reports
The big picture – Today… 20,000 1.3 37,000 100 billion journeys bridges and tunnels million tonnes of freight miles of track
A growth industry In the last 10 years In the next 5 years 22% 60% 14% 50% Passenger volume has increased Freight demand is up Expanding rail usage market Road to rail replacement Source: ORR long-term regulatory statement July 2013
Our Purpose To generate outstanding value for customers and taxpayers We work in control periods Fixed periods of regulatory agreed funding in return for specific outputs Our vision – Leading Railway in Europe “A better railway for a better Britain” NETWORK RAIL
Where does BI fit into the mix? Given the Key challenges • Government under pressure to reduce level of funding • Increase Capacity • To cater for demand growth in Passenger & Freight Traffic • Enhancing & renewing an aging Network • Whilst not just running but improving train performance • And reducing Operating Costs We need to deliver more for less - We are striving to become more intelligent as a business.
Why is data important to Network Rail? • Network Rail is a business which relies on fact based decision making. We collect, store and manage, petabytes and petabytes of data for this purpose. As technology has advanced so has the ability to capture, manage, process and correlate huge quantities of data We are capturing it at an alarming rate – 90% of the worlds data has been created in the past 2 years • Where do we capture data? Measurement Train Timetable Corporate Offices Intelligent Infrastructure Track Inspection Train Performance Supply Chain Assets • Capturing and storing all this data is great, but data is not information…
…so what is information? Over 1,100 transactional / source systems 3 major warehouses Corporate Services Asset Management Network Operations Combining to create our corporate information model Our BI Strategy (in a picture) “Data processed in such a way that it is to be meaningful to the person who receives it” A high level view BI Server • Corporate • Services • Finance • Supply Chain • Procurement • HR • Projects • etc • Asset • Management • Maintenance • Condition Monitoring • etc • Network • Operations • Time Table • Access • Signalling • etc Extract Transform & Load NETWORK RAIL
Last year – our OBIEE footprint • Implemented across all Corporate Support service functions • Upgraded to 11g (new visualisations, new functionality) • Introduced mobility • ORBIS – Asset Data Store (in it’s infancy) • MDM – a common data dictionary Successes Data Quality / Accuracy improvements Less time spent fault finding Headcount Reduction: 22 staff Supplier insight resulting in contractual savings c£2m p.a Time saved in the production of information: 2-3 days per period saved Total Financial benefit to date = c£4m
It was exciting… and let’s go back to the personKey success factor – user adoption rates? Projected Actual
What we’re doing about it. Done • Established recognised core capability • BI minor enhancements fund • Agile factory delivery mechanism • Real mobility Are Doing • Working across the enterprise to shape and implement a target organisation model. • Changing to role based access model • Targetting audiences with robust roll out plans
Additions to the data model Provides the ability to identify underutilisation of training resource. Potential benefit circa £800k per annum
HR GeneralistDashboard The HR Generalist Dashboard officially becomes a live dashboard product on Monday 29th September 2014 for the following users in the HR function (122 employees in total) Lead Human Resources Business Partners Human Resources Business Partners Human Resources Administrators Senior Human Resources Business Partners Human Resources Business Partner Supports HR Resource Assistants • The dashboard allows self-service access to almost real-time (previous night) data and analysis across the following subject areas – from Network Rail Corporate results right down to an Individual Organisation within a Cost Centre: • Employee & Contingent Employee Headcounts, Breakdown of Assignment Statuses and Volumes of New Starters. • Transfers & Movements Analysis broken down into Position and Grade Changes. • Leavers by Involuntary & Voluntary, Performance Rating, Leave Reason and Key Player Retention. • Active Vacancies by Type & Live Applicants by Status. Offers and Internal/External Hires. • Oracle Absence (including Sickness Absence), Absence categories and breakdown of other leave types. Records of Medical Consultations & Limitations. • Training Course Bookings and Delegate statuses, including eLearning. • Average Salaries by Grade for Role Clarity staff, Average HQ Special and Total Ex-Gratia payments by Period through Oracle Payroll. • Diversity & Inclusion metrics including employee demographics by protected characteristics.Analysis by People Managers, Starters, Leavers and applicants at different stages of the Recruitment process. • A separate communication will be sent to those affected employees prior to go live advising how they can access the new reports/dashboards and some guidance on how to use them effectively. /
HRAnalytics–Latest UsageStats 70 60 50 40 30 P11 P12 P13 P1 P2 P3 P4 P5 P6 50 54 57 58 57 56 53 60 64 100 20 50 10 0 0 P11 P12 P13 P1 Total Logins by Period P2 P3 P4 P5 TotalUniqueUsers perPeriod P6 • Period 6 saw increases in total logins and unique users to take both metrics to their highest levels to date. It is anticipated both figures will increase significantly in P7 with the go live of the HR Generalist dashboard. /
In summary • A challenging year • Mistakes were made and lessons learnt • New delivery approach adopted and paying dividends • Roll out more targetted Key take-away’s • Don’t simply focus on the technology • Don’t underestimate the amount of business change