Download
1 / 50
500 likes | 578 Views
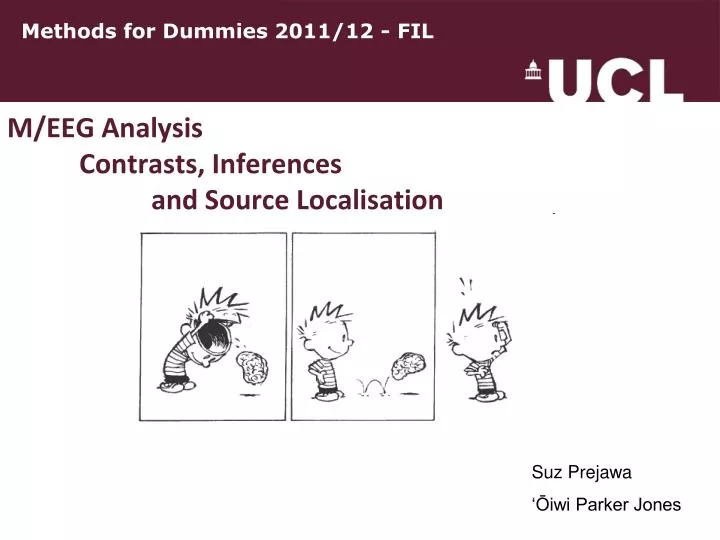
Methods for Dummies 2011/12 - FIL. M/EEG Analysis Contrasts, Inferences and Source Localisation. Suz Prejawa ‘Ōiwi Parker Jones. Let’s get right into it…. experimental design a note on images and lots on image construction in SPM

E N D
Methods for Dummies 2011/12 - FIL M/EEG Analysis Contrasts, Inferences and Source Localisation Suz Prejawa ‘Ōiwi Parker Jones
Let’s get right into it… • experimental design • a note on images and lots on image construction in SPM • The SPM processing pipeline (1st and 2nd level analysis) • maybe a bit on other ways of looking at the data
real word trial real word trial + + spinster spinster time time + + non word trial 600 ms 600 ms stinster 600 ms time time + Experimental DesignMEG data(imagine some technical specification about the MEG machine and the acquisition here… like number of sensors etc)Randomised presentation of(i) 96 real words (spinster) (ii) 96 non-words (stinster) 600 ms 600 ms 600 ms time +
real word trial real word trial + + spinster spinster time time + + 600 ms 600 ms 600 ms time Aim: Identify at what point in time and over what sensor area the greatest difference lies in the responses to words vs nonwords. Steps (i) create an image of the data = MEG 1st level analysis (ii) conduct statistical test = MEG 2nd level analysis (iii) use SPM for source localisation
A word on images • Essentially what you want is a single image file • So, sensor data needs to be converted in SPM • You have a choice (i) to average across your trials to obtain 1 image file per condition (ii) to obtain 1 image file for each trial in every condition (epoch data) • (i) for 2nd level analysis across subjects • (ii) allows within subject statistical tests + comparison across subjects and conditions (essentially looking at levels within conditions)
Averaging trialsan illustration Stimulus/Event Onset X real words O nonwords
Averaging trials Averaging
Note: 275 sensors averaged ERFs Time bins may be as many as 1 per ms From Kilner & Friston, 2010)
A word on interpolationfrom Litvak et al (2011) “… Data in the time domain are converted into an image by generating a scalp map for each time frame and stacking scalp maps over peristimulus time. Scalp maps are generated using the 2D sensor layout specified in the dataset and linear interpolation between sensors. The user is asked to specify the output dimensions of the interpolated scalp map. Typically, we suggest 64 pixels in each spatial direction.” (p4) In other words: You create a 2D space by flattening the sensor locations and interpolating between them to create an image of M*M pixels (where M=number of channels)
Construction of (space × space × time) summary statistic image- Again! A C Construction of a 3D (space × space × time) data volume from sensor-space maps Creation of a single image= what happens in MEG 1st level analysis B from Litvak et al (2011)
Realistically, you might want to choose a particular time slot for your analysis and not look at all time points Example: if we were interested in the N170 component, one could average the data between 150 and 190 milliseconds. 1 Words Nonwords 0 to reduce data that needs to be compared (and subsequently controlled with FWE)
Smoothing • Important step to take before 2nd level analysis (In SPM, use smooth images function in the drop down other menu) • Used to adjust images so that they better conform to the assumptions of random field theory • Necessary for taking into consideration spatial and temporal variability between subjects • General guiding principle: Let smoothing kernel match the data feature you need to enhance. Try to smooth the images with different kernels and see what looks best.
2nd Level Analysis Given the contrast images from the 1st level, we can now test for differences between conditions. 2nd level model = used in fMRI 2nd level contrast 1 -1 SPM output: Voxel map, where each voxel contains one statistical value = + The associated p-value is adjusted for multiple comparisons second level
2ndLEVEL 2 sample t-testDesign Matrix words Non-words
And that is what you end up with… This is not the brain (but sensor space and time) showing where (in the scalp space) there is an effect (in polarity) between the 2 conditions and when after it has been controlled for multiple comparisons from Litvak et al (2011)
Summary- MEG in one slide • Similar to fMRI analysis. The aim of the 1st level is to compute contrast images that provide the input to the second level. • Difference: here we are not modelling the data at 1st level, but simply forming images of data over time At the 1st level, we select periods or time points in peri-stimulous time that we would like to analyse. Time is treated as an experimental factor and we create a 3D image that contains information on polarity over space and time to provide input to the 2nd level Example: when within the N170 component, is there a significant difference in polarity at any given sensor between my 2 conditions (and which sensor areas are these)? 1 Words Nonwords 0
Transform data into frequency spectrum Ideal for induced responses i.e. responses not phase locked to the stimulus onset Different methods but SPM uses the Morlet Waveform Transform (mathematical functions which breaks a signal into different components) Trade off between time resolution and frequency resolution Comparing frequency bands between 2 conditions
Time-Frequency analysis Transform data into time-frequency domain Useful for evoked responses and induced responses: Not phase-locked to the stimulus onset – not revealed with classical averaging methods SPM uses the Morlet Wavelet Transform Wavelets: mathematical functions that can break a signal into different frequency components. [Tallon-Baudry et. al. 1999] The transform is a convolution The Power and Phase Angle can be computed from the wavelet coefficients:
Source localization:I Aim / ApplicationII Theorya) What is recorded (EEG / MEG) b) Forward problem Forward solutions c) Inverse problem Inverse solutions d) Inverse solutions: discrete vs. distributed
I Aim To find a focus of brain activity by analysing the electrical activity recorded from surface electrodes (EEG) or SQUID (Superconductive Quantum Interference Device; MEG)
I Application:- focal epilepsy:spikes - evoked potentials:auditory evoked potentialssomatosensory evoked potentialscognitive event related potentials - induced responses: alpha/beta/gamma oscillations Fries et al., 2008. (also see Barnes et al., 2004 )
IIa What is recorded - EPSP Layer IV radial tangential Lopez daSilva, 2004
IIb Forward problem Forward solution How to model the surfaces i.e. the area between recording electrode and cortical generator? Skin, CSF, skull, brain Realistic shape – (BEM isotropic, FEM anisotropic) Plummer, 2008
Estimated position Estimated data Dipole Fitting Measured data ?
Useful priors for cinema audiences • Things further from the camera appear smaller • People are about the same size • Planes are much bigger than people
Useful priors for MEG analysis • At any given time only a small number of sources are active (Dipole fitting) • All sources are active but overall their energy is minimized (Minimum norm) • As above but there are also no correlations between distant sources (Beamformers)
Oscillatory changes can be co-located with BOLD response fMRI MEG + EEG…? These can also be usefully combined MEG composite Singh et al. 2002
IId SPM source analysis Two aspects of source analysis are *original* in SPM: • Based on Bayesian formalism: generic inversion it can incorporate and estimate the relevance of multiple constraints (data driven relevance estimation – Baysian model comparison) • The subjects specific anatomy incorporated in the generative model of the data
Conclusions/If you only remember one three things! • MEG/EEG inverse problem can be solved…if you have some prior knowledge. • SPM lets you test between priors in a Bayesian framework, and incorporate subject specific anatomy. • Reallyexciting part is the millisecond temporal resolution we can now exploit.
Thanks! • Gareth Barnes • Vladimir Litvak • Marta Garrido • Calvin • Hobbes • And… • you, of course!
Sources – Part 2 • Look under figures • Gareth Barnes’s “The M/EEG inverse problem and • solutions” lecture- Stavroula Kousta / Martin Chadwick (2007, MfD)- Maro Machizawa / Himn Sabir (2008, MfD) • - SPM 8 manual • BESA tutorials (http://www.besa.de), M. Scherg • Dipole Simulator (http://www.besa.de/updates/tools/)
References/ source of information for part 1 Vladimir Litvak, Jérémie Mattout, Stefan Kiebel, et al., “EEG and MEG Data Analysis in SPM8,” Computational Intelligence and Neuroscience, vol. 2011, Article ID 852961, 32 pages, 2011. doi:10.1155/2011/852961 Kilner J, Friston K. (2010) Topological inference for EEG and MEG. Annals of Applied Statistics, 4(3): 1272–1290. Previous MEG MfD talks Vladimir Litvak, Marta Garrido and Gareth Barnes
III The buttons in SPM :Graphical user interface for 3D source localisation
III EEG/MEG imaging pipeline 0) Load the file • Source space modeling • Data co-registration • Forward computation • Inverse reconstruction • Summarizing the results of the inverse reconstruction as an image
1) Source space modeling template MRI
1) Source space modeling • Select mesh size: • - coarse • normal • fine
2) Data co-registration Co-register
2) Data co-registration Methods to co-register • “select” from default locations • “type” MNI coordinates directory • “click” manually each fiducial point from MRI images
3) Forward computation Recommendation: Single shell for MEG BEM for EEG Forward Model
4) Inverse reconstruction Imaging VB-ECD Beamforming
4) Inverse reconstruction Default – click “Standard”: • “MSP” method will be used. MSP : Multiple Sparse Priors (Friston et al. 2008a) Alternatives: • GS (greedy search: default): • iteratively add constraints (priors) • ARD (automatic relevance determination): • iteratively remove irrelevant constraints • COH (coherence): • LORETA-like smooth prior …
4) Inverse reconstruction TIME Time course of the region with maximal activity SPACE Maximal intensity projection (MIP)
5) Summarizing the results of inverse reconstruction as an image Window
5) Summarizing the results of inverse reconstruction as an image 3D NIfTI images allow GLM based statistical analysis (Random field theory)


![[f´‚nE˘RIks]](https://cdn0.slideserve.com/636013/f-ne-riks-dt.jpg)