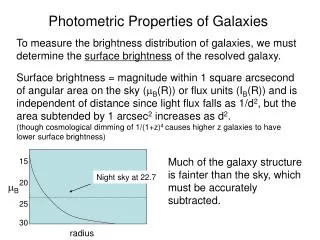
Download
1 / 18
180 likes | 281 Views
Selection and Photometric Properties of K+A Galaxies. Alejandro D. Quintero, David W. Hogg, Michael R. Blanton (NYU), et al. Motivations. SF has been declining since z~1 Milky Way can’t form stars much longer (next few Gyr) How universe is shutting off wrt SF.

E N D
Selection and Photometric Properties of K+A Galaxies Alejandro D. Quintero, David W. Hogg, Michael R. Blanton (NYU), et al.
Motivations • SF has been declining since z~1 • Milky Way can’t form stars much longer (next few Gyr) • How universe is shutting off wrt SF. • Look at galaxies that have ‘just’ stopped forming stars. • K+A galaxies (HDS, Post-Starburst Galaxies)
Data • Taken from SDSS • map 1/4 of entire sky (more than 100 million objects) • measure dist to million nearest galaxies. • 3d picture of local universe (100x before) • ‘most ambitious astronomical survey ever done’ • LSS, galactic evolution, L&D matter, etc…
SDSS • located at Apache Point Observatory, NM
Method In the 80’s Dressler & Gunn found that psb’s are well described sum of A,K spectra • A stars live ~1Gyr • K stars live ~10 Gyr (~ age of universe) • Performed a linear fit of average A,K spectra on every galaxy • gave us ratio A/K (young to old pop) • Also measured H-alpha emission • via Equivalent Width
A and O,B Stars • H-alpha is excited Hydrogen gas (2nd->1st level emission) • Only stars that can excite in this way are O,B • O,B stars live ~0.03 Gyr • A stars: ~ 1 Gyr • A and O,B stars are naturally correlated
Average A and K spectra • ‘A’ , ‘K’ are the number we multiply each spectrum by to make the ‘fit’.
Main Figure • Plot of ‘A/K’ versus H-alpha EW • Clearly shows separate K+A population • Also have simple models • 3, 10, 14 Gyr star formation histories • Used to see how objects move in figure over time • Made by convolving PEGASE spectra and performing same measurements
Results • Present day SFR >> cosmic time averaged mean • Verified Kennicutt IMF as opposed to several others • Are found in full range of environments (not a present-day cluster population) • And…
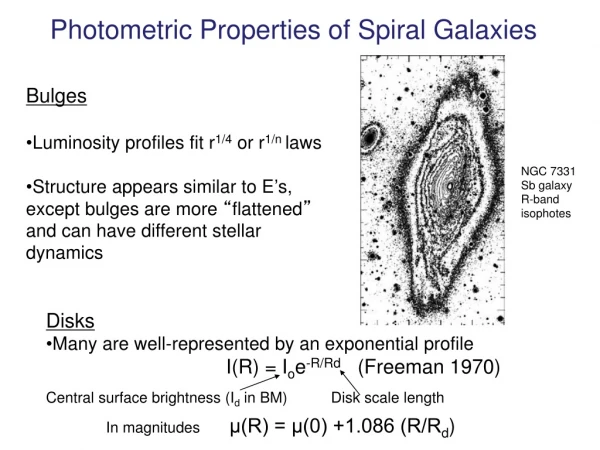
Structure of K+A’s • Are similar to bulge-dominated galaxies but are bluer and…
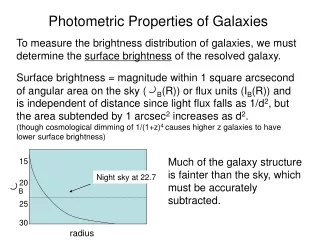
Surface brighness • Also have higher surface brightness (brightest galaxies in the universe)
Luminosity Function • Lum dist is similar to bright (b-d) end of LF. • LF is lum dist weighted by 1/Vmax
Comoving Rate Density • Crude steady state approximation at z~0.1 • Event rate: • ~10^4*h^3*Mpc^3*-Gyr^-1
What K+A’s look like • Mostly bulge dominated (but not all) • Higher average incidence of ‘close pairs’ • ‘close pairs’ ~ mergers
Future Works • Better calculation of even rate (steady state isn’t correct thing to do) • Compare to CDM predictions • K+A populations wrt clustocentric radii • Dark Matter Theory • b-d population is growing by ~1% per Gyr • Does CDM predict this?


![ENVIRONMENTAL PROPERTIES OF z~[1-3] AGN AND STARFORMING GALAXIES:](https://cdn3.slideserve.com/6380619/slide1-dt.jpg)