Download
1 / 16
170 likes | 304 Views
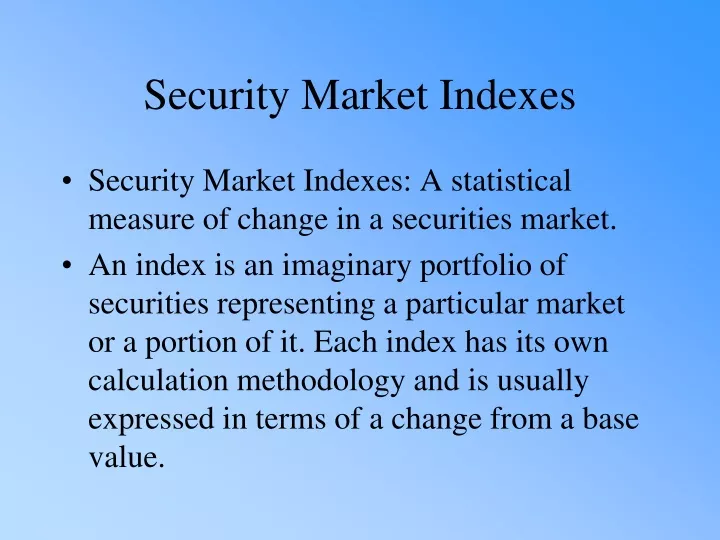
Security Market Indexes. Security Market Indexes: A statistical measure of change in a securities market.

E N D
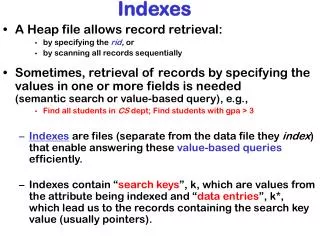
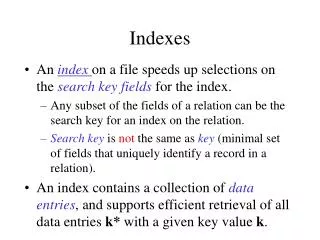
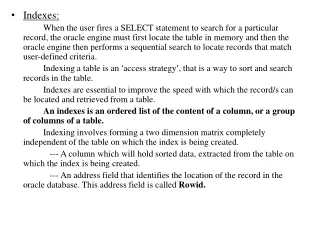
Security Market Indexes • Security Market Indexes: A statistical measure of change in a securities market. • An index is an imaginary portfolio of securities representing a particular market or a portion of it. Each index has its own calculation methodology and is usually expressed in terms of a change from a base value.
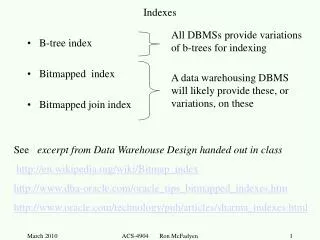
Uses of Security-Market Indexes • As benchmarks to evaluate the performance of professional money managers • To create and monitor an index fund • To measure market rates of return in economic studies • For predicting future market movements by technicians • As a substitute for the market portfolio of risky assets when calculating the systematic risk of an asset
Differentiating Factors in Constructing Market Indexes Weighting of sample members • price-weighted series • value-weighted series • unweighted (equally weighted) series
Stock-Market Indicator Series Price Weighted Series • Dow Jones Industrial Average (DJIA) • Nikkei-Dow Jones Average Value-Weighted Series • NYSE Composite • S&P 500 Index and more… Unweighted Price Indicator Series • Value Line Averages • Financial Times Ordinary Share Index
Dow Jones Industrial Average (DJIA) • Best-known, oldest, most popular series • Price-weighted average of thirty large well-known industrial stocks, leaders in their industry, and listed on NYSE • Total the current price of the 30 stocks and divide by a divisor (adjusted for stock splits and changes in the sample)
Example of Change in DJIA Divisor When a Sample Stock Splits After Three-for One Before Split Split by Stock A Prices Prices A 30 10 B 20 20 C 10 10 60 3 = 20 40 X = 20 X = 2 (New Divisor) Exhibit 5.1
Demonstration of the Impact of Differently Priced Shares on a Price-Weighted Indicator Series Exhibit 5.2 PERIOD T+ 1 . Period T Case A Case B A 100 110 100 B 50 50 50 C 30 30 33 Sum 180 190 183 Divisor 3 3 3 Average 60 63.3 61 Percentage Change 5.5% 1.7%
Criticism of the DJIA • Limited to 30 non-randomly selected blue-chip stocks • Does not represent a vast majority of stocks • The divisor needs to be adjusted every time one of the companies in the index has a stock split
Nikkei-Dow Jones Average • Arithmetic average of prices for 225 stocks on the First Section of the Tokyo Stock Exchange (TSE) • Best-known series in Japan • Price-weighted series formulated by Dow Jones and Company • The 225 stocks represent 15 percent of all stocks on the First Section
Value-Weighted Series • Derive the initial total market value of all stocks used in the series Market Value = Number of Shares Outstanding X Current Market Price • Assign an beginning index value (100) and new market values are compared to the base index • Automatic adjustment for splits • Weighting depends on market value
Value-Weighted Series where: Indext = index value on day t Pt = ending prices for stocks on day t Qt = number of outstanding shares on day t Pb = ending price for stocks on base day Qb = number of outstanding shares on base day
Value-Weighted Series December 31, 2005 Stock Price No of share Market value A 10 1000 $10,000 B 15 6000 90,000 C 20 5000 100,000 200,000 Base value equal to an index is 100
Value-Weighted Series December 31, 2006 Stock Price No of share Market value A 12 1000 $12,000 B 10 12000 120,000 C 20 5500 110,000 242,000 New index value = (242,000/200,000)*100 = 121
Unweighted Price Indicator Series • All stocks carry equal weight regardless of price or market value • May be used by individuals who randomly select stocks and invest the same dollar amount in each stock • Some use arithmetic average of the percent price changes for the stocks in the index
Unweighted Price Indicator Series • Value Line and the Financial Times Ordinary Share Index compute a geometric mean of the holding period returns and derive the holding period yield from this calculation
Unweighted Price Indicator Series • GM=[1.2*.91*1.07]^(1/3) AM = (.2-.09+.07)/ 3 = 1.0531 = 0.06 Index value (T+1)=Index value (T)*1.053 = 100*1.053 or 100*1.06 = 105.3 or 106