Download
1 / 30
300 likes | 465 Views
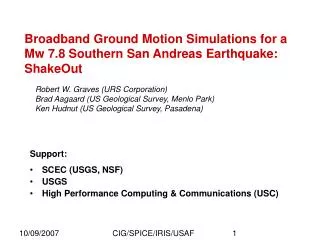
Ground Motion Prediction and Scenario Earthquake Simulations. Robert Graves US Geological Survey. Ground Motion P rediction R esources OpenSHA CyberShake Broadband Simulation Platform WebSims (simulation distribution portal) Scenario Earthquakes for Engineering Applications (TBI, etc.)

E N D
Ground Motion Prediction and Scenario Earthquake Simulations Robert Graves US Geological Survey • Ground Motion Prediction Resources • OpenSHA • CyberShake • Broadband Simulation Platform • WebSims (simulation distribution portal) • Scenario Earthquakes for Engineering Applications (TBI, etc.) • Puente Hills (then and now) • Northern San Andreas • Hayward • Southern San Andreas
OpenSHAwww.opensha.org Field et al. (SRL, 2003) • Probabilistic and Deterministic Seismic Hazard Analysis • Open Source • Transparency • Multiple developer tracks • Modular Components (object-oriented framework) • Variety of Earthquake Rupture Forecasts (including UCERF2) • Variety of Ground Motion Prediction Equations (including NGA) • Available Applications • Attenuation Relation Plotter • GMT Map Plotter • Hazard Curve Calculator • Hazard Spectrum Calculator • Magnitude Frequency Distribution • Scenario ShakeMap Generator
CyberShake Graves et al. (2010) • Full Waveform Seismic Hazard Model • Replace GMPEs with physics-based simulations • Account for space-time variations in earthquake probabilities • 3D Simulations (T > 2 sec) for all ruptures in UCERF2 • Each rupture has multiple realizations (combinations of hypocenter and slip distribution) • Over 400,000 Rupture Scenarios • Products Include • Database of scenario ruptures • Waveforms and response spectra • OpenSHA Interface • Hazard Curves • Hazard Maps • On-the-fly Probability Updates
Broadband Simulation Platform http://scec.usc.edu/research/cme/groups/broadband Callaghan et al. (Poster this meeting) • Computational Platform for Broadband Simulations • Transparency of methods (version control) • Remote access (including non-developers) • Independent testing and validation • Modular framework allows integration of new approaches • Rupture generator for validation and scenario events • High frequency simulation • Low frequency simulation • Combination into broadband • Site response • Products Include • Broadband waveforms • Rupture visualization • Goodness-of-fit comparison
WebSimshttp://scec.usc.edu/websims Olsen and Ely (SRL, 2009) • Prototype Ground-Motion Simulation Distribution Portal • Web application providing access to four-dimensional (x,y,z,t) simulation datasets • Extraction of point waveforms and 2D wave field slices • Filtering, plotting and waveform comparison modules • Access to simulation metadata • Currently Available Simulations • ShakeOut kinematic rupture • ShakeOut dynamic ruptures • M5.4 Chino Hills • M7.7.5 Elsinore • M8 So. San Andreas Cui et al. (2010)
Puente Hills Graves and Somerville (8NCEE, 2006) • Mw 7.15 Blind Thrust beneath Los Angeles • Relatively rare event, but potentially significant consequences • Initial simulation in 2006, revisited 2010 • Significant reduction in high frequency levels • Low frequency levels basically unchanged
Puente Hills Thrust Fault System • Northward dipping, blind thrust directly beneath downtown Los Angeles • 4 large events in last 12,000 years • Mw 6.7 to 7.2+ depending on segmentation and slip • 1987 Mw 5.9 Whittier Narrows EQ after Shaw et al., BSSA, 2002; Dolan et al., Science, 2003
South North • Directivity • Buried thrust rupture • Hanging wall • Basin response • Dense Urbanization James Dolan (USC), John Shaw (Harvard)
Broadband Simulation Refinements from 2006 to 2010 • Broadband Site Amplification Factors • Rupture Evolution Characterization
Broadband Site Amplification Factors 2006: Based on Borcherdt (1994) - weak non-linearity 2010: Based on Campbell-Bozorgnia (2008) - stronger non-linearity Significant reduction in high frequency ground motion levels
Rupture Evolution Characterization 2006: Weak timing perturbations 2010: Strong timing perturbations Significant reduction in rupture coherence
Northern San Andreas (1906-type) Aagaard et al. (BSSA, 2008) • Ground Motion estimates for Mw 7.8 1906 and hypothetical scenario EQs • Collaborative effort involving multiple modeling groups • 3D USGS Bay Area Seismic Velocity Model • Detailed representation of SAF geometry • 1906 Modeling • Source characterization based on Song et al. (2006) • Simulations within 1 MMI of Boatwright and Bundock (2005) intensities • Scenarios • Stochastic slip with north, central and south hypocenters • Strong directivity in SF region for north and south hypocenters
1906 Observed and Simulated Intensities Observed Boatwright and Bundock (2005) Simulated
Scenario Ruptures: Effect of Hypocenter on MMI North Hypocenter 1906 Hypocenter South Hypocenter
Hayward Aagaard et al. (BSSA, 2010) • Multiple rupture scenarios with Mw 6.76 – 7.12 • Collaborative effort involving multiple modeling groups • 3D USGS Bay Area Seismic Velocity Model • Detailed representation of east-Bay fault geometry • Mw 6.76 bilateral HS rupture reasonably consistent with 1868 intensities • Rupture Complexities • Multiple segment ruptures (Rogers Creek, Hayward N & S, Calaveras) • Creeping sections • Simulated motions exhibit strong rupture directivity and basin response effects
1680 Southern San Andreas (ShakeOut) Graves et al. (EQ Spectra, 2010) • Mw 7.8 scenario • Average time between previous events: 150 years (or less) • Rupture characterization requires multi-disciplinary input • Rupture length • Magnitude • Slip distribution • Slip function • Rupture velocity • Hypocenter 1906 Creepingsection 1857
1812 1857 1680 Slip (m) thrusting & folding WGCEP Slip Rates: 20±3 10±3 16±3 22±6 28±7 San Gorgonio Pass SOUTH NORTH Coachella Valley Mojave Static Displacement Characterization Slip Predictable Model: total release of strain accumulated since most recent event Relatively high static stress drop event
Summary • Variety of ground motion prediction resources are currently available or being developed • Simulation capabilities are continually being refined and updated with new information • Rupture characterization • High frequency (f > 0.5 Hz) ground-motion modeling • Feedback and interaction with engineering community is a vital component of this process