Download
1 / 2

E N D
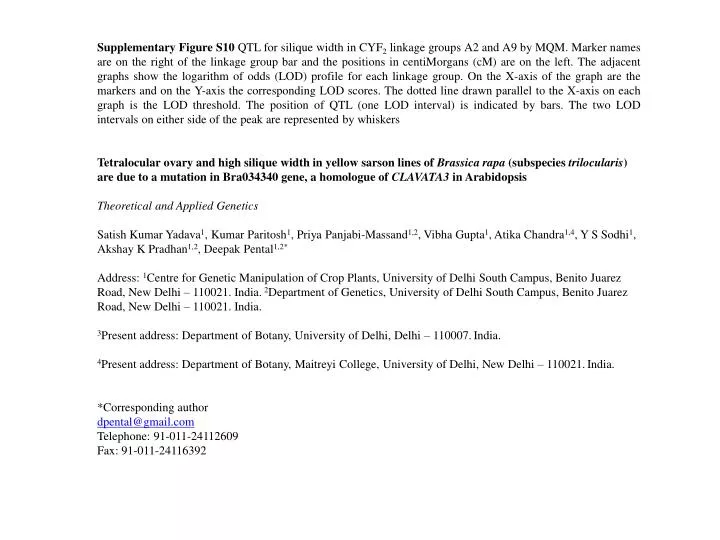
Supplementary Figure S10 QTL for siliquewidth in CYF2 linkage groups A2 and A9 by MQM. Marker names are on the right of the linkage group bar and the positions in centiMorgans (cM) are on the left. The adjacent graphs show the logarithm of odds (LOD) profile for each linkage group. On the X-axis of the graph are the markers and on the Y-axis the corresponding LOD scores. The dotted line drawn parallel to the X-axis on each graph is the LOD threshold. The position of QTL (one LOD interval) is indicated by bars. The two LOD intervals on either side of the peak are represented by whiskers Tetralocular ovary and high silique width in yellow sarson lines of Brassica rapa (subspecies trilocularis) are due to a mutation in Bra034340 gene, a homologue of CLAVATA3 in Arabidopsis Theoretical and Applied Genetics Satish Kumar Yadava1, Kumar Paritosh1, Priya Panjabi-Massand1,2, Vibha Gupta1, Atika Chandra1,4, Y S Sodhi1, Akshay K Pradhan1,2, Deepak Pental1,2* Address: 1Centre for Genetic Manipulation of Crop Plants, University of Delhi South Campus, Benito Juarez Road, New Delhi – 110021. India. 2Department of Genetics, University of Delhi South Campus, Benito Juarez Road, New Delhi – 110021. India. 3Present address: Department of Botany, University of Delhi, Delhi – 110007.India. 4Present address: Department of Botany, Maitreyi College, University of Delhi, New Delhi – 110021.India. *Corresponding author dpental@gmail.com Telephone: 91-011-24112609 Fax: 91-011-24116392
A2-CYF2 A9-CYF2 0 1 2 3 4 5 0 1 2 3 4 5 6 7 cnu_m617a At1g43245 0.0 0.0 At5g08280.1 7.1 BrGMS331 7.5 nia_m025a 12.0 At3g27100.1 8.4 BrGMS656 14.1 cnu_m118a 16.9 At5g15470.2 CYF2-Sw2 22.3 At5g15860 At5g25080 18.7 At5g15680 22.6 At5g16750 23.5 At5g16630 23.9 BrGMS395 31.5 cnu_m004a 34.9 At1g62640 38.2 BrGMS316 40.0 BrGMS209 40.0 BrGMS583 41.7 At5g53560 44.9 cnu_m568a.2 48.7 BrGMS224 48.9 At2g44870 50.6 At2g26670.2 49.9 At5g37600.2 52.1 At1g67550 54.7 At3g51610.2 57.4 At1g72380 60.7 At3g51010 58.8 cnu_m568a.1 64.3 At1g16460 65.1 nia_m016a 66.7 cnu_m544a 65.7 BrGMS588 67.4 BrGMS787.2 67.0 At2g43370.2 • CYF2-Sw9 67.2 cnu_m425a.1 71.4 BrGMS3321 75.6 cnu_m007a 77.1 At1g18730 82.0 cnu_m574a 85.4 cnu_m360a.2 84.0 At2g20585 BrGMS75 87.8 At2g21120.2 86.3 BrGMS236 88.3 At5g25940 BrGMS461 93.2 93.2 BrGMS4481 103.7 BrGMS11 105.9 BrGMS412 106.8 At1g05205 111.1 Supplementary Figure S10 QTL for silique width in CYF2 linkage groups A2 and A9 by MQM. Marker names are on the right of the linkage group bar and the positions in centiMorgans (cM) are on the left. The adjacent graphs show the logarithm of odds (LOD) profile for each linkage group. On the X-axis of the graph are the markers and on the Y-axis the corresponding LOD scores. The dotted line drawn parallel to the X-axis on each graph is the LOD threshold. The position of QTL (one LOD interval) is indicated by bars. The two LOD intervals on either side of the peak are represented by whiskers