Download
1 / 76
760 likes | 763 Views
This study examines the trends in hemoglobin levels, erythropoietin (EPO) dose, and iron dose in incident and prevalent hemodialysis patients. It analyzes data from the first 6 months of therapy and explores the relationship between these variables and factors like age, gender, race/ethnicity, and modality.

E N D
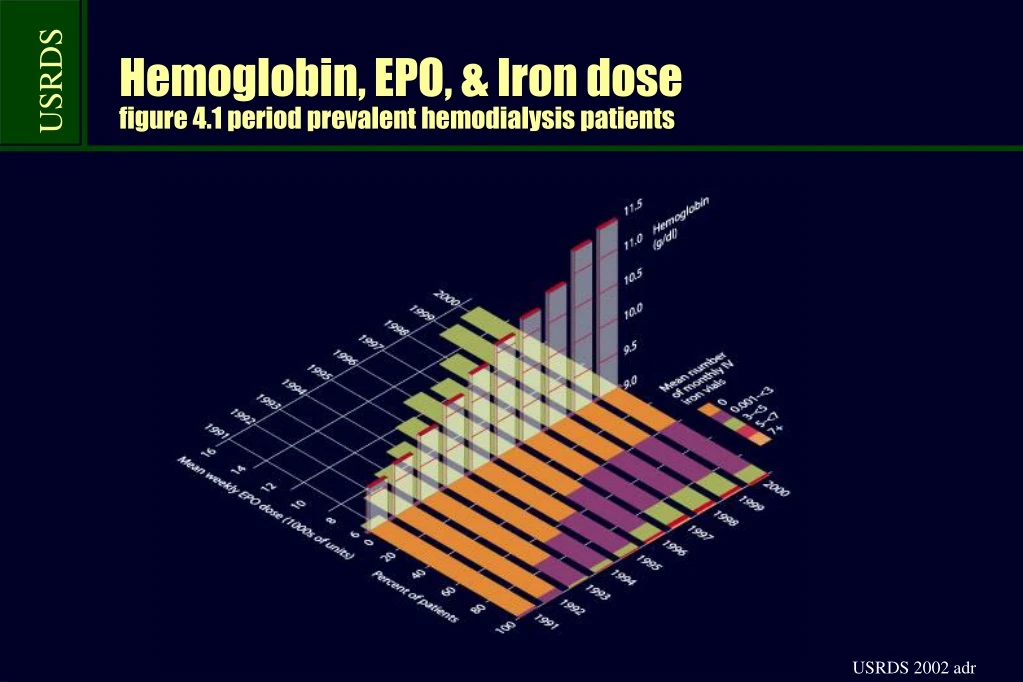
Hemoglobin, EPO, & Iron dosefigure 4.1 period prevalent hemodialysis patients
Mean monthly hemoglobin at initiation of therapy & in the first 6 months of ESRDfigure 4.2, incident hemodialysis patients
Mean EPO dose per week after initiation of & in the first 6 months of ESRDfigure 4.3, incident hemodialysis patients
Percent of patients receiving iron at initiation of therapy & in the first 6 months of ESRDfigure 4.4, incident hemodialysis patients
Mean monthly hemoglobin by initial Hb from the ME formfigure 4.5, incident dialysis patients, 1995-2000 combined
Mean EPO dose per week by initial Hb from the ME formfigure 4.6, incident dialysis patients, 1995-2000 combined
Percentage of patients receiving iv iron by initial Hb from the ME formfigure 4.7, incident dialysis patients, 1995-2000 combined
Prevalent patient counts, by data sourcetable 4.a, point prevalent ESRD patients; only patients with data in both databases
Prevalent patient counts, by data sourcetable 4.a, point prevalent ESRD patients; only patients with data in both databases (cont.)
Trends in mean hemoglobin, by modality, iron use, data source, & EPO usefigure 4.8
Trends in mean hemoglobin, by modality, iron use, data source, & EPO usefigure 4.8 (cont.)
Trends in mean EPO dose per week, by modality, iron use, & data sourcefigure 4.9
Trends in mean EPO dose per week, by modality, iron use, & data sourcefigure 4.9 (cont.)
Trends in mean hemoglobin, by modality, age, gender, & race/ethnicityfigure 4.10, period prevalent dialysis patients
Trends in mean EPO dose per week, by modality, age, gender, & race/ethnicityfigure 4.11, period prevalent dialysis patients
Trends in mean hemoglobin, by modality, age, gender, & race/ethnicityfigure 4.10, period prevalent dialysis patients
Trends in mean hemoglobin, by modality, age, gender, & race/ethnicityfigure 4.10, period prevalent dialysis patients (cont.)
Trends in mean EPO dose per week, by modality, age, gender, & race/ethnicityfigure 4.11, period prevalent dialysis patients
Trends in mean EPO dose per week, by modality, age, gender, & race/ethnicityfigure 4.11, period prevalent dialysis patients (cont.)
Trends in patient distribution, by mean monthly hemoglobinfigure 4.12, period prevalent dialysis patients 100 13+ 12.5-<13 80 12-<12.5 s t 60 en ti 11-<12 a p f o t 40 en rc e P 10-<11 20 <10 0 1991 1992 1993 1994 1995 1996 1997 1998 1999 2000 2001
Trends in patient distribution, by rolling three-month mean hemoglobinfigure 4.13, period prevalent dialysis patients 100 13+ 12.5-<13 80 12-<12.5 s t 60 11-<12 en ti a p f o t 40 en rc e P 10-<11 20 <10 0 1992 1993 1994 1995 1996 1997 1998 1999 2000 2001
Trends in mean monthly hemoglobin & mean EPO dose per weekfigure 4.14, period prevalent dialysis patients
Mean hemoglobin: hemodialysisfigure 4.15, period prevalent hemodialysis patients, 2000, by HSA, unadjusted Mean hemoglobin (g/dl) 11.69+ (11.87) 11.57 to <11.69 11.45 to <11.57 11.30 to <11.45 below 11.30 (11.11)
Mean EPO dose: hemodialysisfigure 4.16, period prevalent hemodialysis patients, 2000, by HSA, unadjusted Mean weekly EPO dose 17,030+ (19,707) 15,270 to <17,030 13,880 to <15,270 12,120 to <13,880 below 12,120 (9,976)
Mean hemoglobin, all-cause infections:no infectionsfigure 4.17, period prevalent hemodialysis patients, 2000, by HSA, unadjusted Mean hemoglobin (g/dl) 11.79+ (12.00) 11.64 to <11.79 11.52 to <11.64 11.36 to <11.52 below 11.36 (11.10)
Mean hemoglobin, all-cause infections:1-2 infectionsfigure 4.17, period prevalent hemodialysis patients, 2000, by HSA, unadjusted Mean hemoglobin (g/dl) 11.79+ (12.04) 11.64 to <11.79 11.52 to <11.64 11.36 to <11.52 below 11.36 (11.04)
Mean hemoglobin, all-cause infections:2-3 infectionsfigure 4.17, period prevalent hemodialysis patients, 2000, by HSA, unadjusted Mean hemoglobin (g/dl) 11.79+ (12.08) 11.64 to <11.79 11.52 to <11.64 11.36 to <11.52 below 11.36 (10.97)
Mean hemoglobin, all-cause infections:3-5 infectionsfigure 4.17, period prevalent hemodialysis patients, 2000, by HSA, unadjusted Mean hemoglobin (g/dl) 11.79+ (12.20) 11.64 to <11.79 11.52 to <11.64 11.36 to <11.52 below 11.36 (10.79)
Mean hemoglobin, all-cause infections:5+ infectionsfigure 4.17, period prevalent hemodialysis patients, 2000, by HSA, unadjusted Mean hemoglobin (g/dl) 11.79+ (12.34) 11.64 to <11.79 11.52 to <11.64 11.36 to <11.52 below 11.36 (10.53)
Mean hemoglobin, all-cause infections:at least 1 infectionfigure 4.17, period prevalent hemodialysis patients, 2000, by HSA, unadjusted Mean hemoglobin (g/dl) 11.79+ (12.10) 11.64 to <11.79 11.52 to <11.64 11.36 to <11.52 below 11.36 (11.02)
Mean weekly EPO dose, all-cause infections: no infectionsfigure 4.18, period prevalent hemodialysis patients, 2000, by HSA, unadjusted Mean EPO dose 16,330+ (19,026) 14,590 to <16,330 13,250 to <14,590 11,550 to <13,250 below 11,550 (9,402)
Mean weekly EPO dose, all-cause infections: 1-2 infectionsfigure 4.18, period prevalent hemodialysis patients, 2000, by HSA, unadjusted Mean EPO dose 16,330+ (20,759) 14,590 to <16,330 13,250 to <14,590 11,550 to <13,250 below 11,550 (8,305)
Mean weekly EPO dose, all-cause infections: 2-3 infectionsfigure 4.18, period prevalent hemodialysis patients, 2000, by HSA, unadjusted Mean EPO dose 16,330+ (21,947) 14,590 to <16,330 13,250 to <14,590 11,550 to <13,250 below 11,550 (8,044)
Mean weekly EPO dose, all-cause infections: 3-5 infectionsfigure 4.18, period prevalent hemodialysis patients, 2000, by HSA, unadjusted Mean EPO dose 16,330+ (22,375) 14,590 to <16,330 13,250 to <14,590 11,550 to <13,250 below 11,550 (8,144)
Mean weekly EPO dose, all-cause infections: 5+ infectionsfigure 4.18, period prevalent hemodialysis patients, 2000, by HSA, unadjusted Mean EPO dose 16,330+ (22,235) 14,590 to <16,330 13,250 to <14,590 11,550 to <13,250 below 11,550 (7,891)
Mean weekly EPO dose, all-cause infections: at least 1 infectionfigure 4.18, period prevalent hemodialysis patients, 2000, by HSA, unadjusted Mean EPO dose 16,330+ (20,287) 14,590 to <16,330 13,250 to <14,590 11,550 to <13,250 below 11,550 (8,542)
Mean hemoglobin & mean EPO dose per week: all-cause infectionsfigure 4.19, period prevalent hemodialysis patients age 20+, 2000
Mean hemoglobin & mean EPO dose per week: all-cause infectionsfigure 4.19, period prevalent hemodialysis patients age 20+, 2000 (cont.) Number of inpatient hospital stays, per patient year at risk, with infection as the principal diagnosis All · All patients, regardless of status 1+ · Patients with at least one stay during year A · Patients with no stays B · Patients with 1–<2 stays C · Patients with 2–<3 stays D · Patients with 3–<5 stays E · Patients with five or more stays
Mean hemoglobin & mean EPO dose per week: catheter infectionsfigure 4.20, period prevalent hemodialysis patients age 20+, 2000
Mean hemoglobin & mean EPO dose per week: catheter infectionsfigure 4.20, period prevalent hemodialysis patients age 20+, 2000 (cont.) Number of inpatient hospital stays, per patient year at risk, with infection as the principal diagnosis All · All patients, regardless of status 1+ · Patients with at least one stay during year A · Patients with no stays B · Patients with 1–<2 stays C · Patients with 2–<3 stays D · Patients with 3–<5 stays E · Patients with five or more stays
Mean hemoglobin & mean EPO dose per week: catheter insertionsfigure 4.21, period prevalent hemodialysis patients age 20+, 2000
Mean hemoglobin & mean EPO dose per week: catheter insertionsfigure 4.21, period prevalent hemodialysis patients age 20+, 2000 (cont.) Number of catheter (temporary & permanent) insertions per patient year All · All patients, regardless of status 1+ · Patients with at least one insertion during year a · Patients with no insertions b · Patients with 1 insertion c · Patients with >1–2 insertions d · Patients with >2–3 insertions e · Patients with three or more insertions
Distribution of median URR, by gender (claims data)figure 4.23, period prevalent hemodialysis patients
Geographic variations in the % of patients meeting the K/DOQI target URR of 65%: 1998figure 4.24, period prevalent hemodialysis patients, by HSA, unadjusted Percent of patients 87.1+ (89.2) 86.1 to <87.1 85.3 to <86.1 84.0 to <85.3 below 84.0 (81.1)
Geographic variations in the % of patients meeting the K/DOQI target URR of 65%: 1999figure 4.24, period prevalent hemodialysis patients, by HSA, unadjusted Percent of patients 87.1+ (89.0) 86.1 to <87.1 85.3 to <86.1 84.0 to <85.3 below 84.0 (82.7)
Geographic variations in the % of patients meeting the K/DOQI target URR of 65%: 2000figure 4.24, period prevalent hemodialysis patients, by HSA, unadjusted Percent of patients 87.1+ (88.8) 86.1 to <87.1 85.3 to <86.1 84.0 to <85.3 below 84.0 (83.3)
Geographic variations in the % of pts meeting the K/DOQI target URR of 65%: % change, 1998-2000figure 4.24, period prevalent hemodialysis patients, by HSA, unadjusted Percent change, 1998-2000 7.45+ (9.98) 5.76 to <7.45 4.22 to <5.76 2.52 to <4.22 below 2.52 (1.24)
Median URR, by unit characteristics: hemodialysis patientsfigure 4.25, period prevalent hemodialysis patients, claims data, 2000
Trends in mean weekly Kt/V, by unit characteristics: peritoneal dialysis patientsfigure 4.26, CPM data