Download
1 / 38
590 likes | 1.81k Views
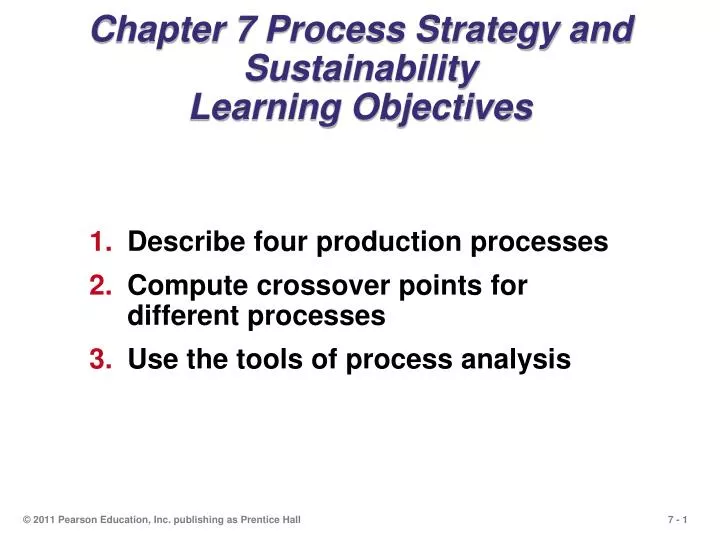
Chapter 7 Process Strategy and Sustainability Learning Objectives. Describe four production processes Compute crossover points for different processes Use the tools of process analysis. Learning Objectives. When you complete this chapter you should be able to:.

E N D
Chapter 7 Process Strategy and Sustainability Learning Objectives Describe four production processes Compute crossover points for different processes Use the tools of process analysis © 2011 Pearson Education, Inc. publishing as Prentice Hall
Learning Objectives When you complete this chapter you should be able to: Describe customer interaction in process design Identify recent advances in production technology Discuss the 4 Rs of sustainability © 2011 Pearson Education, Inc. publishing as Prentice Hall
Process Strategies The objective of a process strategy is to build a production process that meets customer requirements and product specifications within cost and other managerial constraints © 2011 Pearson Education, Inc. publishing as Prentice Hall
Volume Low Volume Repetitive Process High Volume Process, Volume, and Variety Figure 7.1 High Variety one or few units per run, (allows customization) Process Focus projects, job shops (machine, print, hospitals, restaurants) Arnold Palmer Hospital Mass Customization (difficult to achieve, but huge rewards) Dell Computer Changes in Modules modest runs, standardized modules Repetitive (autos, motorcycles, home appliances) Harley-Davidson Changes in Attributes (such as grade, quality, size, thickness, etc.) long runs only Product Focus (commercial baked goods, steel, glass, beer) Frito-Lay Poor Strategy (Both fixed and variable costs are high) © 2011 Pearson Education, Inc. publishing as Prentice Hall
Process Strategies • How to produce a product or provide a service that • Meets or exceeds customer requirements • Meets cost and managerial goals • Has long term effects on • Efficiency and production flexibility • Costs and quality © 2011 Pearson Education, Inc. publishing as Prentice Hall
Process Strategies Four basic strategies Process focus Repetitive focus Product focus Mass customization Within these basic strategies there are many ways they may be implemented © 2011 Pearson Education, Inc. publishing as Prentice Hall
Process Focus • Facilities are organized around specific activities or processes • General purpose equipment and skilled personnel • High degree of product flexibility • Typically high costs and low equipment utilization • Product flows may vary considerably making planning and scheduling a challenge © 2011 Pearson Education, Inc. publishing as Prentice Hall
Many inputs (surgeries, sick patients, baby deliveries, emergencies) (low volume, high variety, intermittent processes) Arnold Palmer Hospital Many departments and many routings Many different outputs(uniquely treated patients) Process Focus Figure 7.2(a) © 2011 Pearson Education, Inc. publishing as Prentice Hall
Repetitive Focus • Facilities often organized as assembly lines • Characterized by modules with parts and assemblies made previously • Modules may be combined for many output options • Less flexibility than process-focused facilities but more efficient © 2011 Pearson Education, Inc. publishing as Prentice Hall
Raw materials and module inputs (multiple engine models, wheel modules) Few modules (modular) Harley Davidson Modules combined for many Output options (many combinations of motorcycles) Repetitive Focus Figure 7.2(b) © 2011 Pearson Education, Inc. publishing as Prentice Hall
Product Focus • Facilities are organized by product • High volume but low variety of products • Long, continuous production runs enable efficient processes • Typically high fixed cost but low variable cost • Generally less skilled labor © 2011 Pearson Education, Inc. publishing as Prentice Hall
Few Inputs (corn, potatoes, water, seasoning) (low-volume, high variety, continuous process) Frito-Lay Output variations in size, shape, and packaging (3-oz, 5-oz, 24-oz package labeled for each material) Product Focus Figure 7.2(c) © 2011 Pearson Education, Inc. publishing as Prentice Hall
Mass Customization • The rapid, low-cost production of goods and service to satisfy increasingly unique customer desires • Combines the flexibility of a process focus with the efficiency of a product focus © 2011 Pearson Education, Inc. publishing as Prentice Hall
Number of Choices Item 1970s 21st Century Vehicle models 140 286 Vehicle types 18 1,212 Bicycle types 8 211,000 Software titles 0 400,000 Web sites 0 162,000,000 Movie releases per year 267 765 New book titles 40,530 300,000 Houston TV channels 5 185 Breakfast cereals 160 340 Items (SKUs) in 14,000 150,000 supermarkets LCD TVs 0 102 Mass Customization Table 7.1 © 2011 Pearson Education, Inc. publishing as Prentice Hall
Many parts and component inputs (chips, hard drives, software, cases) Many modules (high-volume, high-variety) Dell Computer Many output versions (custom PCs and notebooks) Mass Customization Figure 7.2(d) © 2011 Pearson Education, Inc. publishing as Prentice Hall
Mass Customization • Imaginative and fast product design • Rapid process design • Tightly controlled inventory management • Tight schedules • Responsive supply chain partners © 2011 Pearson Education, Inc. publishing as Prentice Hall
Comparison of Processes Table 7.2 © 2011 Pearson Education, Inc. publishing as Prentice Hall
Variable costs Variable costs Variable costs $ $ $ Fixed costs Fixed costs Fixed costs Repetitive Process B High volume, low variety Process C Low volume, high variety Process A $ Total cost Total cost Total cost 400,000 300,000 200,000 Fixed cost Process C Fixed cost Process B Fixed cost Process A V1 V2 (6,666) (2,857) Volume Crossover Charts Figure 7.4 © 2011 Pearson Education, Inc. publishing as Prentice Hall
Process Analysis and Design • Flow Charts - Shows the movement of materials • Time-Function Mapping - Shows flows and time frame © 2011 Pearson Education, Inc. publishing as Prentice Hall
Customer Sales Order Production control Order Product Plant A Extrude Order product Process order Wait Wait Wait Wait WIP Print Product Warehouse Move Move Receive product WIP Product WIP WIP Plant B Transport 12 days 13 days 1 day 4 days 1 day 10 days 1 day 0 day 1 day 52 days “Baseline” Time-Function Map Figure 7.5 © 2011 Pearson Education, Inc. publishing as Prentice Hall
Process Analysis and Design • Flow Charts - Shows the movement of materials • Time-Function Mapping - Shows flows and time frame • Value-Stream Mapping - Shows flows and time and value added beyond the immediate organization • Process Charts - Uses symbols to show key activities • Service Blueprinting - focuses on customer/provider interaction © 2011 Pearson Education, Inc. publishing as Prentice Hall
Service Blueprinting • Focuses on the customer and provider interaction • Defines three levels of interaction • Each level has different management issues • Identifies potential failure points © 2011 Pearson Education, Inc. publishing as Prentice Hall
Personal Greeting Service Diagnosis Perform Service Friendly Close Customer arrives for service. (3 min) Customer departs Level #1 F Customer pays bill. (4 min) Determine specifics. (5 min) Notifycustomerand recommendan alternativeprovider. (7min) Warm greeting and obtain service request. (10 sec) No F Standard request. (3 min) Canservice bedone and does customer approve? (5 min) F Level #2 Direct customer to waiting room. No Notify customer the car is ready. (3 min) F Perform required work. (varies) F F F Yes Yes Prepare invoice. (3 min) F Service Blueprint Level #3 Figure 7.8 © 2011 Pearson Education, Inc. publishing as Prentice Hall
Process Analysis Tools • Flowcharts provide a view of the big picture • Time-function mapping adds rigor and a time element • Value-stream analysis extends to customers and suppliers • Process charts show detail • Service blueprint focuses on customer interaction © 2011 Pearson Education, Inc. publishing as Prentice Hall
Improving Service Processes • Layout • Product exposure, customer education, product enhancement • Human Resources • Recruiting and training • Impact of flexibility © 2011 Pearson Education, Inc. publishing as Prentice Hall
Equipment and Technology • Often complex decisions • Possible competitive advantage • Flexibility • Stable processes • May allow enlarging the scope of the processes © 2011 Pearson Education, Inc. publishing as Prentice Hall
Production Technology • Machine technology • Automatic identification systems (AISs) • Process control • Vision system • Robot • Automated storage and retrieval systems (ASRSs) • Automated guided vehicles (AGVs) • Flexible manufacturing systems (FMSs) • Computer-integrated manufacturing (CIM) © 2011 Pearson Education, Inc. publishing as Prentice Hall
Automatic Identification Systems (AISs) • Improved data acquisition • Reduced data entry errors • Increased speed • Increased scope of process automation Example – Bar codes and RFID © 2011 Pearson Education, Inc. publishing as Prentice Hall
Process Control • Real-time monitoring and control of processes • Sensors collect data • Devices read data on periodic basis • Measurements translated into digital signals then sent to a computer • Computer programs analyze the data • Resulting output may take numerous forms © 2011 Pearson Education, Inc. publishing as Prentice Hall
Vision Systems • Particular aid to inspection • Consistently accurate • Never bored • Modest cost • Superior to individuals performing the same tasks © 2011 Pearson Education, Inc. publishing as Prentice Hall
Robots • Perform monotonous or dangerous tasks • Perform tasks requiring significant strength or endurance • Generally enhanced consistency and accuracy © 2011 Pearson Education, Inc. publishing as Prentice Hall
Automated Storage and Retrieval Systems (ASRSs) • Automated placement and withdrawal of parts and products • Reduced errors and labor • Particularly useful in inventory and test areas of manufacturing firms © 2011 Pearson Education, Inc. publishing as Prentice Hall
Automated Guided Vehicle (AGVs) • Electronically guided and controlled carts • Used for movement of products and/or individuals © 2011 Pearson Education, Inc. publishing as Prentice Hall
Flexible Manufacturing Systems (FMSs) • Computer controls both the workstation and the material handling equipment • Enhance flexibility and reduced waste • Can economically produce low volume at high quality • Reduced changeover time and increased utilization • Stringent communication requirement between components © 2011 Pearson Education, Inc. publishing as Prentice Hall
Computer-Integrated Manufacturing (CIM) • Extension of flexible manufacturing systems • Backwards to engineering and inventory control • Forward into warehousing and shipping • Can also include financial and customer service areas • Reducing the distinction between low-volume/high-variety, and high-volume/low-variety production © 2011 Pearson Education, Inc. publishing as Prentice Hall
Technology in Services Table 7.4 © 2011 Pearson Education, Inc. publishing as Prentice Hall
Process Redesign • The fundamental rethinking of business processes to bring about dramatic improvements in performance • Relies on reevaluating the purpose of the process and questioning both the purpose and the underlying assumptions • Requires reexamination of the basic process and its objectives • Focuses on activities that cross functional lines • Any process is a candidate for redesign © 2011 Pearson Education, Inc. publishing as Prentice Hall
Sustainability • Sustainability in production processes • Resources • Recycling • Regulations • Reputation © 2011 Pearson Education, Inc. publishing as Prentice Hall