Download
1 / 32
320 likes | 398 Views
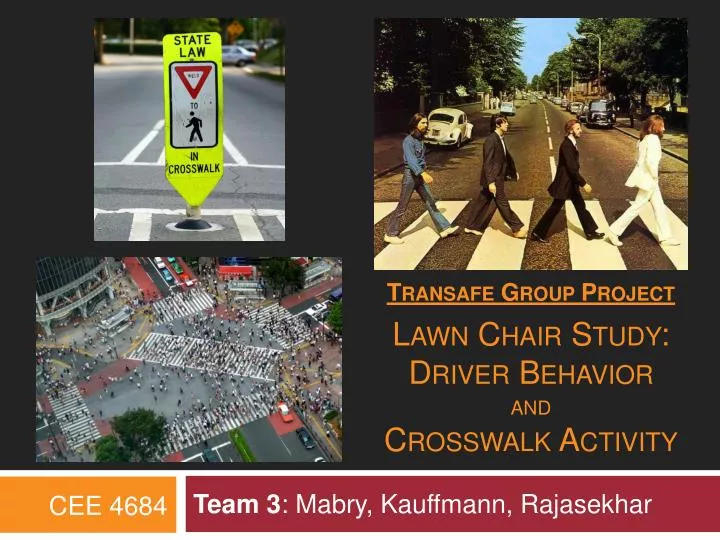
Transafe Group Project Lawn Chair Study: Driver Behavior and Crosswalk Activity. Team 3 : Mabry, Kauffmann, Rajasekhar. CEE 4684. Introduction. Driver Impatience Hard to define Factors Frequent traffic congestion: Vehicles, Pedestrians Driver stress:

E N D
Transafe Group ProjectLawn Chair Study:Driver Behaviorand Crosswalk Activity Team 3: Mabry, Kauffmann, Rajasekhar CEE 4684
Introduction • Driver Impatience • Hard to define • Factors • Frequent traffic congestion: Vehicles, Pedestrians • Driver stress: • Personal – stress disorders, time crunch • Situational – mismatch between expected and existing road and traffic conditions • Individual driver differences: difficult to account for
Introduction • Different levels of impatience • Mild Impatience (our study) • Inching into crosswalk, tailgating, speeding, frequent and unsafe lane changes, severing around pedestrians etc • Severe driver aggression • Intentional following of a vehicle off the road, physical/psychological damage to property or person etc.
Introduction • Virginia Tech has around 30,000+ full time students • Frequently accessed academic buildings and activity centers surround the Drillfield • Subsequently, busiest crosswalks are those adjacent to the Drillfield • The peak usage of the crosswalks is during the 15-minute break between consecutive classes
Introduction • Not much studies related to driver impatience due to busy crosswalks • A study on driver behavior on Robert Morris University campus by Jade Hart, 2009 says: • students under stress may not take the time to fully stop at stop signs • Another study by DeVeauuse, et al., 1999; Hendrick, 2000 predicts: • faculty will comply with stop signs more frequently than students
Operational Definitions • Impatience is hard to quantify • Impatience Metrics • Inching into Crosswalk • Honking/Yelling • Revving engine • Deviating path/swerving around pedestrians • Vehicle contact with pedestrians • Different levels of impatience exist • Use a weighted scoring system to develop the Driver Impatience Score (DIS)
Operational Definitions • Situations where the drivers enter the crosswalk after the pedestrian(s) has almost crossed the crosswalk is not considered under driver impatience • Vehicles which were in queue but later on drive through the crosswalk with no wait time due to the absence of pedestrians are not included in the data collection
Study • An attempt to analyze and quantify various driver impatience matrices and to determine the DIS • Evaluation of the relationship between wait time and DIS • Determine the relation if any between various other factors like driver gender and age, vehicle type and number of occupants etc. and driver impatience
Hypothesis The wait time exhibited by a driver waiting at a crosswalk with pedestrians is a contributing factor to driver impatience. This wait time may be used in conjunction with driver and vehicle characteristics to predict the impatience exhibited by a subject vehicle.
Experimental Design • Choose a location for measurements • Each potential study area had flaws Source: Google Maps
Experimental Design • McBryde Crosswalk Source: Google Maps
Experimental Design • War Memorial Gym Crosswalk Source: Google Maps
Experimental Design • Final Site: Alumni Mall Intersection Source: Google Maps
Data Collection • Desired Data (Potential IVs) • Driver Characteristics: Age, Gender • Vehicle Characteristics: Type, # Occupants • Wait Time Data: In-queue and Front-of-queue • Impatience Metrics (DVs)
Data Collection • Methodology • Use “time stamps” versus recording actual wait time • All stations record color and make for data aggregation • Distribution of observation by location • Observer Stations • 1 – Back of Queue: Vehicle and driver information, time entering queue • 2 – Front of Queue: Crosswalk time stamps, assist in classifying impatience metrics • 3 – Crosswalk: Driver impatience metrics
Data Collection • Collection Periods • Observations made over three days • Same time period: Monday/Wednesday 1:00-2:25 • Captured two class changes: M/W 1:10-1:25 and 2:15-2:30 • Left early to get to class on time • Captured enough data to determine 43 impatience scores
Driver Impatience Score • To consider the severity of the impatience metric and the frequency with which it occurred, a Driver Impatience Score (DIS) was calculated for each driver • DIS = Total Sum [Weighted Score x Frequency] • Ex. Vehicle 001 (DIS) = Honking/Yelling (2x2)+ Dev Path (3x1)=7d
Statistical Analyses • Descriptive Stats • Mean, standard deviation, and range • Correlations • Examine the relationship between driver wait time at a crosswalk during high pedestrian traffic and measures of driver impatience (DIS) • Multiple linear regression • Examine the relationship between DIS and potential predictors including wait time, driver demographic information (age, gender), occupant and vehicle information
Statistical Analyses • Statistical Package for the Social Sciences (SPSS v.15) • Statistical significance was set at p=0.05
Conclusions • There is a positive association between driver impatience and wait time • R-statistic = 0.335 • In the regression, the only factor that proved predictive of driver impatience was wait time • Significant at p=0.04 • No other observed independent variables were significant • Graphically, no trend was observed due to excessive spread in the data • Only 16% of the variance in driver impatience was explained by the model which included wait time, driver demographic info, vehicle and occupant info
Next Steps • More data collection • More study locations • Various times of day • Additional independent variables • Analyze wait time components • Proposed pedestrian metering system
Any Questions? • References • Dulaa, Chris S. and E. Scott Gellerb, Risky, Aggressive, or Emotional Driving: Addressing the Need for Consistent Communication in Research, Journal of Safety Research(2003), pp 559-566 • Driver Aggression, AA Motoring Trust (April 1997) • Hart, Jade. Driver behavior on campus: A Robert Morris University Case Study, Annual Western Pennsylvania Undergraduate Psychology Conference (April 2009) • Hennessy, Dwight A. and David L. Wiesenthal, Gender, Driver Aggression and Driver Violence: An Applied Evaluation, Vol. 44 (June 2001) • Nasar, Jack L. Prompting Drivers to Stop for Crossing Pedestrians, Transportation Research Part F 6(2003), 175-182 • Sarkar, S. et. Al., Spatial and Temporal Analyses of the Variations in Aggressive Driving and Road Rage Behaviors Observed and Reported on San Diego Freeways, Transportation Research Record (2000)