Download
1 / 10
110 likes | 392 Views
How to Perform Simple Manual Item Analysis. Dr. Belal Hijji, RN, PhD January 18, 2012. Learning Outcomes. At the end of this short training session, students will be able to: Compute two item analysis indices of a multiple-choice examination. Identify item construction flaws, if any.

E N D
How to Perform Simple Manual Item Analysis Dr. Belal Hijji, RN, PhD January 18, 2012
Learning Outcomes At the end of this short training session, students will be able to: • Compute two item analysis indices of a multiple-choice examination. • Identify item construction flaws, if any.
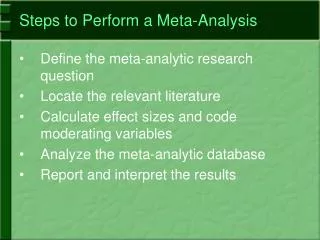
Steps for Computing Item Analysis Indices • After scoring the test, arrange the scores from the highest to the lowest. • Divide the scores into top 50% and lower 50% of all scores. • For each item, tally the number of students in each group who selected each option. Record these counts on a copy of the test item next to each response option. For example: Item 1: Which of the following is a modifiable risk factor for coronary artery disease? Higher 50% Lower 50% • Hypertension*1313 • Family history 0 1 • Age 2 1 • Race 0 0
Steps for Computing Item Analysis Indices • Apply the following equation to calculate the difficulty index for each item: P = (Rh + Rl)/ T. An item is easy, moderately difficult (acceptable), or difficult if its p value is ≥ .80, between .21 and .79, and ≤ .20, respectively. Rh is the number of students in the top 50% who selected the correct option, Rl is the number of students in the lower 50% who selected the correct option, and T is the total number of students. For the example on the previous slide, the P-value is (13 + 13)/ 30 = .87.
Steps for Computing Item Analysis Indices (Continued…) 5. Calculate the discrimination index (D) for each item. This is done by dividing the Rh by the total number of students in the top 50%. This will yield Ph. Repeat the process to calculate Pl from Rl. Subtract Pl from Ph to obtain D. For the example on slide 3, Ph = 13/15 = .87; Pl = 13/15 = .87. The D = .87- .87 = 0, indicating that the item’s discriminatory power is nonexistent. However, A discrimination index of .20 or higher is appropriate • Check each item for implausible distractors, ambiguity and miskeying. Look at the table on next slide to find out how plausible was each distracter for item 1.
Computations of Item Analysis Indices Distracter “D” is implausible because none of the lower 50% students selected it. As this item is easy (p = .87),its ability to discriminate between the top and lower 50% of examinees is zero.
Example 2 • Item 2: What may happen to a patient if rapid administration of cold blood is performed through a central venous route terminating in or near the right atrium? The number of examinees was 298. • Higher 50% Lower 50% • Post transfusion purpura 14 14 • Cardiac arrhythmia* 141 52 • Acute intravascular haemolytic reaction 18 37 • Transfusion associated acute lung injury 13 9 Look at this item’s analysis indices on next slide
Computations of Item Analysis Indices What can you conclude when the number of examinees is large? This is a good item because it is moderately difficult, has good discriminatory power, and all its distractors are plausible.
Where Do You Go From Here? Based on the training you received, please continue working on the test until you compute the difficulty and discrimination indices for each item and tabulate the data.
References • Oermann, M. and Gaberson, K. (2009).Evaluation and Testing in Nursing Education. 3rd edition. New York: Springer.