Download
1 / 28
280 likes | 430 Views
STAT131 Week 9 Lecture 2 Hypothesis Testing Single Proportions. Anne Porter alp@uow.edu.au. Lecture Outline. Tests of Significance Testing Hypotheses (5 steps) Null and alternative hypotheses level of significance (Errors) Testing for population proportions. Tests of Significance.

E N D
STAT131Week 9 Lecture 2 Hypothesis Testing Single Proportions Anne Porter alp@uow.edu.au
Lecture Outline • Tests of Significance • Testing Hypotheses (5 steps) • Null and alternative hypotheses • level of significance (Errors) • Testing for population proportions
Tests of Significance • Decisions through Data Video Tape 5, Unit 21
Lecture Outline • Testing for population proportions • Testing for population means • ( known) • ( unknown) • Large n, small n
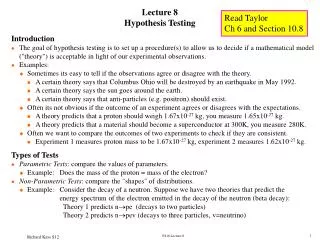
Significance Tests - Formal 1. Null and alternative hypotheses 2. Assign 3. Select a statistic and determine the rejection region 4. Perform the experiment and calculate the observed value of T or Z or… 5. Draw conclusions
1. Null and Alternative hypothesestwo-tailed • the null hypothesis may be p = 0.5 and • alternative hypothesis p ≠ 0.5 • the null hypothesis may be = 0 and • alternative hypothesis ≠ 0. • Later we will see others Tests of proportions Tests of means
1. Hypotheses -One tailed • the null hypothesis may be p = 0.5 and • alternative hypothesis p > 0.5 is one tailed (the possibility that p < 0.5 is not considered) • the null hypothesis may be = 0 and • alternative hypothesis > 0 is one tailed Test of proportion Tests of means
1. Hypotheses - one tailed Tests of Proportions • the null hypothesis may be p = 0.5 and • alternative hypothesis p < 0.5 is one tailed • (the possibility that p > 0.5 is not considered) • the null hypothesis may be = 0 and • alternative hypothesis < 0 is one tailed Tests of means
1. Null and Alternative hypotheses • Specify hypotheses BEFORE data are examined • Do not let the data determine our hypotheses • IF previous research has indicated that one there is a reason to suggest that p or is wrong then a one tailed hypothesis may be specified.
2. Assign • is determined such that we have a desired level of confidence in our procedures (ie in our results). • The 100(1- )% level of confidence
3. Select a test statistic and... determine the rejection region • For example a test about proportions (means of the zero and 1 response), if the sample is large we can use a Z test and the standard normal distribution
3... determine the rejection region • For a two-tailed test • That is the hypotheses are of the form • H0::p = p0 • H1 :p≠ p0 • With a 95% CI that is = 0.05 The =0.05 is split into both ends of the distribution and we Find the z corresponding to Z 0.975, and Z 0.025
3... note • For a two-tailed test • That is the hypotheses are of the form • H0::p = p0 • H1 :p≠ p0 It would also be possible to do a 2 test where we have SuccessFailure Obs Expected But not for a one-sided test
Critical value of Z • If |Z|>Z /2 • If |Z|>Z .025 • If the Z<-1.96 or Z >1.96 • Then the null hypothesis of there being no difference in means is rejected
5. Draw Conclusions • Given the two-tailed test • Reject H0 if That is if | Z| >1.96
Errors When we draw a conclusion there are two possible errors we can make =Level of significance = probability of a type I error = Probability of a type II error
Errors • Type 1 Error • Rejecting the null hypothesis when it is true • P(Reject H0| H0true)= • Accepting the null hypothesis when it is false • P(Accept H0|H0 is false) =
Power of a test • When the alternative hypothesis is true, the probability of making the correct decision is called the power of a test • Power of the test=1- • We can make =0 by always accepting H0 but then =1 and vice versa. Value of depends on the value of the population mean under H1. As values of the population mean moves away from , the values of become smaller
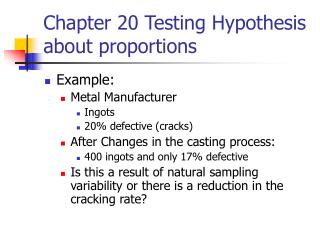
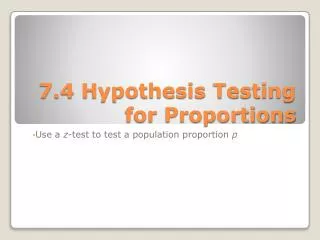
Testing population proportions1 Specify Hypotheses and 2 specify a • At the 95% level of confidence test the hypothesis that the population proportion p is 0.56 against the alternative that it is not equal to 0.56 • H0::p = p0 • H1 :p≠ p0 that is • H0::p = 0.56 • H1 :p≠ 0.56
Testing population proportions2 specify • At the 95% level of confidence test the hypothesis that the population proportion p is 0.56 against the alternative that it is not equal to 0.56 • =0.05 • Choose the test statistic (what sort of sampling distribution can be used for the mean of samples where the original data are 0/1)
Testing population proportions 3 - Choose the statistic and determine R • unknown but sample size large (n>30) • Hence Where is the proportion of successes and p0 is the hypothesised population proportion
Testing population proportions 3 - Choose the statistic and determine R • Reject H0 if So for the 95% level of confidence IF Reject H0
Testing population proportions 4. Perform experiment & calculate the statistic • Data collected from STAT131 in 2002 found that 106 of the 131 students passed. Is this consistent with the hypothesis that the proportion of students passing is 0.56
Testing population proportions 4... & calculate the statistic • 106 of the 131 students passed. Is this consistent with the hypothesis that the proportion of students passing is 0.56
Testing population proportions 4... & calculate the statistic • 106 of the 131 students passed. Is this consistent with the hypothesis that the proportion of students passing is 0.56
Testing population proportions Draw Conclusions • As |11.6| >1.96 • Then we reject H0: p = 0.56 and • Reject the hypothesis that the true population proportion is equal to 0.56 is and retain the alternative H1 :p≠ 0.56