Download
1 / 3
30 likes | 40 Views
<br>http://healthydogtreats.com.au/<br><br>The first reason that dog population values are hard to obtain is that they either rely on dog<br>registrations (which are a fraction of real world dog populations) or surveys of human populations<br>which only sample a tiny percentage of the human population and extrapolate.<br><br>

E N D
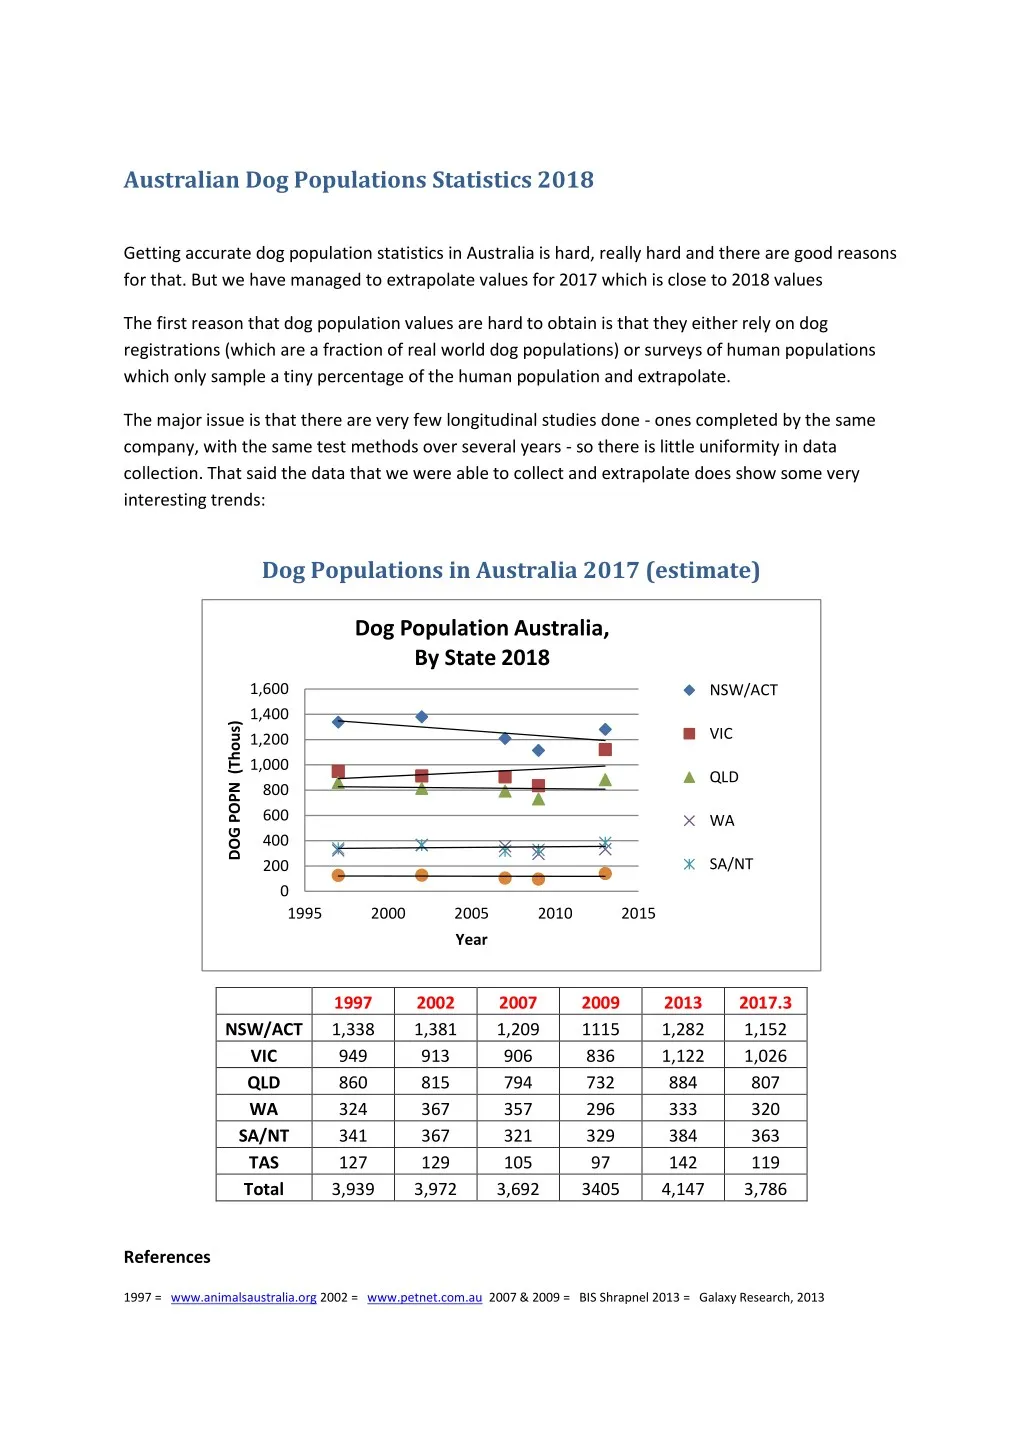
Australian Dog Populations Statistics 2018 Getting accurate dog population statistics in Australia is hard, really hard and there are good reasons for that. But we have managed to extrapolate values for 2017 which is close to 2018 values The first reason that dog population values are hard to obtain is that they either rely on dog registrations (which are a fraction of real world dog populations) or surveys of human populations which only sample a tiny percentage of the human population and extrapolate. The major issue is that there are very few longitudinal studies done - ones completed by the same company, with the same test methods over several years - so there is little uniformity in data collection. That said the data that we were able to collect and extrapolate does show some very interesting trends: Dog Populations in Australia 2017 (estimate) Dog Population Australia, By State 2018 1,600 NSW/ACT 1,400 DOG POPN (Thous) VIC 1,200 1,000 QLD 800 600 WA 400 SA/NT 200 0 1995 2000 2005 2010 2015 Year 1997 1,338 949 860 324 341 127 3,939 2002 1,381 913 815 367 367 129 3,972 2007 1,209 906 794 357 321 105 3,692 2009 1115 836 732 296 329 97 3405 2013 1,282 1,122 884 333 384 142 4,147 2017.3 1,152 1,026 807 320 363 119 3,786 NSW/ACT VIC QLD WA SA/NT TAS Total References 1997 = www.animalsaustralia.org 2002 = www.petnet.com.au 2007 & 2009 = BIS Shrapnel 2013 = Galaxy Research, 2013
The state of the dog industry in Australia There have been many reports on the dog industry in the last few years, how people are treating their dogs like fur-babies (humanising them) and spending much on premium food, grooming and other services. However costs such as vet visits, pet insurance etc have sky-rocketed in the last few years. This combined with the psychographics including income levels of the typical dog owner in Australia confirm that dogs are becoming an item that can only be afforded by the more dedicated or well heeled individuals. These two dog statistic tables confirm this information. IN particular you will see that between 1997 and 2007 that dog populations recorded a reduction in each measured year after 1997 (ie a drop in 2002 and then 2007). Back then, this put the dog industry in a spin. What if dogs were falling out of favour? Bis Shrapnel did the measurements for 2007 and 2009 and we were still seeing a reduction in dog populations. But this was a time of the Global Financial Crisis. Just security and general income were in great doubt across the country, so that partially explains the continual decline in dog numbers. So is the first substantial jump in dog populations between 2009 and 2013 a factor of Australia's economic recovery or something else? Yes the data is reported by another company than the previous ones but with Australia highly tied to the resources industry for GDP growth, and relatively flat income growth levels surely economic recovery cant explain everything here. Australian Dog ownership per 100 People (1994 to 2009) 1994 1998 2002 2005 2007 2009 Dog Popn (mil) Dogs per 100 people 3.78 4 3.97 3.75 3.69 3.41 N/A 20 20 18 18 16 (Reference Biz Shrapnel) It is the above table that puts the dog population and dog ownership statistics into clearer focus. While the dog populations table and graphs at the start of this report and in particular linear trend lines, suggest that dog number are either relatively steady or a slight rise for Victoria and slight decline for NSW (the two most populous states) these are just dog population numbers in isolation. The table immediately above shows what dog populations look like in a rising market (increasing human populations). Even though dog populations look relatively stable with maybe a slight upturn
between 2013 and 2018 their relative populations are decreasing. Or more precisely the relative number of people interested in owning them has declined. This is because the human population growth rate is much higher than the dog population growth rate that dog ownership numbers (dogs per 100 people) are in decline. Note while the total Australian dog populations numbers (first row of the table) are in general agreement with the first table data (that includes state level data), the stats for the Dogs per 100 people data is by the one company. And this company prides itself of data integrity even if they did not originate the data. The main take away here is that while dog populations are relatively flat from the mid 1990's to 2009, the 'dogs per 100 people' consistently tracks downwards from 20 to 16 per 100 people - a very big drop. Why Australian dog populations decreased between 1995 and 2009 Dogs have always been Australians favourite big pet. Their cleverness, loyalty and companionship surpasses many human to human relationships. It is my contention that this dip in dog ownership was more caused by the rise of the internet and online entertainment devices taking up the time and interest of the human population during this time. As electronic devices started moving from the workplace and task driven to entertainment devices for consumers, people found themselves with less time for things like dogs. If you have ever walked a dog regularly you will know how much time and other resources they can consume. Australian Dog populations post 2009. The first smart phones began mid 2000's and 2007 marked a major uptake in these devices with the first iphone release. But by 2011 most of the negative consumer sentiment to do with the economy (GFC crisis) had passed. The increase in smart and powerful online entertainment devices had weeded out the pretenders in dog ownership by 2011.. The smaller pool of dog owners (percentage wise) were the people more serious about their dog's health and 'lifestyle'. This smaller group were ready to spend more money on premium pet food, mobile groomers and dog bling (coats, collars and accessories). The other major cause of capping the dog population is the urbanisation of our population and the cost of housing. Smaller backyards and apartment living in particular reduces the practicality of owning a dog. CONCLUSION While the major health benefits (physical and mental) of owning a dog are well documented. Depriving dogs of off lead time with their kind to satisfy their strong pack needs, substantially reduces the quality of life of many dogs in urban environments with time poor owners. The relative reduction in dog ownership for the general population might be a factor of online entertainment and housing costs and size pressures, but it might actually provide those dogs that are owned with a better quality of life. Report Created by http://healthydogtreats.com.au/