Download
1 / 26
260 likes | 268 Views
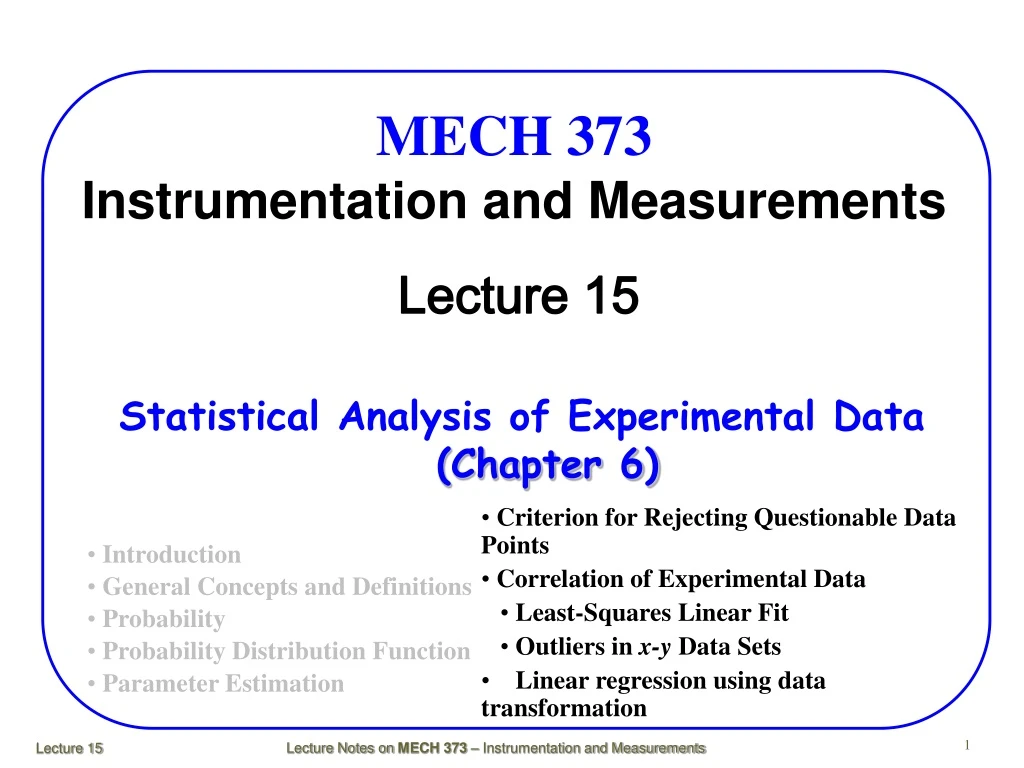
MECH 373 Instrumentation and Measurements. Lecture 15. Statistical Analysis of Experimental Data (Chapter 6). • Criterion for Rejecting Questionable Data Points • Correlation of Experimental Data • Least-Squares Linear Fit • Outliers in x-y Data Sets

E N D
MECH 373Instrumentation and Measurements Lecture 15 Statistical Analysis of Experimental Data (Chapter 6) • • Criterion for Rejecting Questionable Data Points • • Correlation of Experimental Data • • Least-Squares Linear Fit • • Outliers in x-y Data Sets • Linear regression using data transformation • Introduction • General Concepts and Definitions • Probability • Probability Distribution Function • Parameter Estimation
Criterion for Rejecting Questionable Data Points • In some experiments, it happens that one or more measured data points appears to be out of the line with the rest of the data. • If some clear fault can be detected in measuring those specific values, they should be discarded. • But often the seemingly faulty data cannot be traced to any specific problem. • Data that lie outside the probability of normal variation can bias the statistical analysis.
Criterion for Rejecting Questionable Data Points • There are several statistical methods for detecting and rejecting these wild or outlier data points. • The simplest method for the outlier detection is called the three-sigma test. • In this method, first calculate the mean and the standard deviation from the data set and then label all the data points that lie outside the range of 99.7% probability of occurrence. That is outside the range • Another recommended method is called the modified Thompson τtechnique. • In this method, if we have n measurements that have a mean x and standard deviation S, the data can be arranged in ascending order. • The extreme values (i.e. highest and lowest) are suspected outliers. • For these suspected points, the deviation is calculated as • In the next step, for the given value of n, the value of τ is obtained from Table 6.8.
Criterion for Rejecting Questionable Data Points • Compare the largest value of δiwith the product of τ and standard deviation S. • If δ > τS, the data value (xi) can be rejected as the outlier. • This method rejects one data value at a time. Thus, the process needs to be repeated with the recomputed values of mean and standard deviation of the remaining data, and continued until no more of the data can be eliminated. • It should be noted that eliminating an outlier is not an entirely positive event. • The outlier may be resulted from a problem with the measuring system, the influence of extraneous variable or the measurement apparatus.
Nine voltage measurements: 12.02, 12.05, 11.96, 11.99, 12.10, 12.03, 12.00, 11.95 and 12.16V. Vmean = 12.03V, S = 0.07. D1 = |Vlargest – Vmean| = |12.16 – 12.03| = 0.13. D2 = |Vsmallest – Vmean| = |11.95 – 12.03| = 0.08. Table 6.8, n = 9, τ = 1.777. S τ = 0.07x1.777 = 0.12. D1 > S τ , 12.16 rejected. Re-calculate Vmean and S with 8 measurements. Vmean = 12.01V, S = 0.05. Table 6.8, n = 8, τ = 1.749. S τ = 0.05x1.749 = 0.09. D1 = |Vlargest – Vmean| = |12.10 – 12.01| = 0.09. D2 = |Vsmallest – Vmean| = |11.95 – 12.01| = 0.06. No rejection. Example Rejecting Questionable Data Points
Correlation of Experimental Data Correlation Coefficient • Scatter due to random errors is a common characteristic of virtually all measurements. • However, in some cases, the scatter is so large that it is difficult to detect a trend. For example, Fig. 6.11. • Figure (a) shows a strong relationship between x and y. • Figure (b) does not show any functional relationship between x and y. • Figure (c) shows some vague relationship between x and y, however, it could be a consequence of pure chance.
Correlation of Experimental Data • • A statistical parameter that can be used to determine whether the apparent trend between two variables is real or simply be a consequence of a pure chance is called correlation coefficient, rxy. • • The magnitude of rxyis used to determine whether there is a functional relationship between the two variables x and y and if it is strong or week. • • Consider from an experiment, we obtained a set of n data pairs of variables x and y, i.e. [(xi,yi), i = 1, 2, 3, …, n]. • • The linear correlation coefficient, rxycan be computed as • where
Correlation of Experimental Data • The values of rxylie in the range from -1 to +1. • A value of rxy= +1 indicates a perfectly linear relationship between x and y with a positive slope (i.e. increasing x results in increasing y). • A value of rxy= -1 also indicates a perfectly linear relationship between x and y but with a negative slope (i.e. increasing x results in decreasing y). • A value of rxy= 0 indicates there is no linear relationship between x and y. However, in real data, even when there is no correlation between the two variables, the value of rxyis usually nonzero. • To determine if the computed value of correlation coefficient indicates a functional relationship between the two variables or the trend is purely due to chance, the minimum values of the correlation coefficient (rt) for different significance or confidence levels are used which are presented in the table below.
Correlation of Experimental Data • For the given n number of data pairs and for a given confidence level, if the real linear relationship exists between the two variables otherwise, if we cannot be confident that a linear functional relationship between the two variables exists. • It should be noted that rxyonly indicates if a linear relationship exists between the two variables. If the relationship between the two variables is nonlinear e.g. polynomial, exponential, etc, rxywill not be a good indicator. • Outliers could have a significant effect on the correlation coefficient; therefore, outliers should be removed before computing the correlation coefficient.
Correlation of Experimental Data Least-Squares Linear Fit • It is a common requirement in experimentation to correlate experimental data by fitting mathematical function such as, straight lines or exponentials through the data. • Straight lines are the most common functions used for this purpose. • Linear fits are often appropriate for the data, and in other cases, the data can be transformed to be approximately linear. • If we have n pairs of data (xi, yi), we seek to fit a straight line through the data of the form Y = ax + b • We would like to obtain values of the constants a and b which provides the best fit to the data.
Least-Squares Linear Fit • A systematic approach to obtain the best fit is called the method of least-squares or linear regression. • Regression is a well-defined mathematical formulation that is readily automated. • Consider data consists of pairs (xi, yi). For each value of xi, we can predict a value of Yiaccording to the linear relationship Y = ax + b. • For each value of xi, we have an error and the square of the error is • The sum of the squared errors for all the data points is then • We now choose a and b to minimize E. Thus
Least-Squares Linear Fit • These two equations can be solved for a and b: • The resulting equation, Y = ax + b, is called the least-squares best fit to the data represented by (xi, yi). • When a linear regression analysis has been performed, it is important to determine how good the fit actually is. • A good measure of the adequacy of the regression model is called the coefficient of determination, given by
Least-Squares Linear Fit • For a good fit, r2 should be close to unity. • Another measure to estimate how well the best-fit line represents the data is called the standard error of estimate, given by • This is the standard deviation of the differences between the data points and the best-fit line, and it has the same units as y.
Least-Squares Linear Fit Best fit line: a = 0.9977, b = 0.0295, Y = 0.9977x + 0.0295. Standard error of estimate = 0.0278. Coefficient of determination: y mean = 1.27666. r 2 = 0.999286. High value close to unity – Good fit.
Least-Squares Linear Fit • • Many computer software packages include features to perform the regression analysis. For example, Excel, Matlab, etc. • • The advantage of using the software is that you can try polynomial fits of different orders and select the suitable one. • • There are some important considerations about the least-squares method. • • Variation in the data is assumed to be normally distributed and due to random causes. • • In deriving the relation Y = ax + b, it is assumed that random variation exists in y, while x values are error free. • • Since the error has been minimized in the y direction, an erroneous conclusion can be made if x is estimated based on a value for y. That is, linear regression of x in terms of y (i.e. X = cy + d) cannot simply be derived from Y = ax + b.
Outliers in x-y Data Sets • We discussed about how to detect outliers when static measurements are made. That is, several measurements of a single variable. • When a variable y is measured as a function of an independent variable x, in most cases, there is only one value of y for each value of x. • One way of identifying the outlier is to plot the data and the best fit line and identify the outlier that has much larger deviation from the line than the other data. • A more sophisticated method of identifying outliers in x-y data set is by computing the ratio of the residuals (ei) to the standard error of estimate (Syx), which is called the standardized residual.
Outliers in x-y Data Sets • If the residuals are normally distributed, it is expected that 95% of the standardized residuals would be in the range ±2. That is, within two standard deviations from the best-fit line. • If the standardized residual is much greater than 2 then it could be considered as the outlier. • Determination of outliers in x-y data sets is not a simple mechanistic process. • The experimenter can use plots of data with the best-fit, plots of standardized residuals, but ultimately it is a judgment call as to whether reject any data point.
Example - Outliers in x-y Data Sets • Water-turbine experiment: • Fit least squares straight line. Check outlier.
Water turbine data: Example - Outliers in x-y Data Sets
Torque = at 600rpm, ei/Syx > 2 – high probability of being outlier. Example - Outliers in x-y Data Sets
Linear Regression Using Data Transformation • • Non-linear relationship can be transformed to linear equation. • e.g. y = aebx ; In y = bx + In(a) • Example: Compression process in a piston cylinder – Temperature and pressure relationship: • T/To = (P/Po) (n-1)/n • T = Absolute temperature = Tabs (K) = T + 460 • P = Absolute pressure = Gauge pressure + atmospheric pressure (14.7psi) • To and Po = reference data. • In (T) = a In (P) + b • a = (n-1)/n, b = Constant • In(T+460) = 0.1652 In(P) + 5.72222
Linear Regression Using Data Transformation • • Non-linear relationship can be transformed to linear equation. • .
Linear Regression Using Data Transformation • • Non-linear relationship can be transformed to linear equation.