Download

1 / 65
650 likes | 795 Views
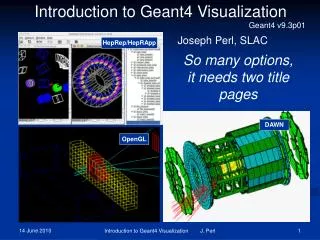
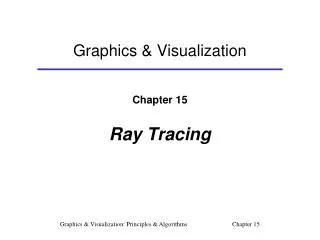
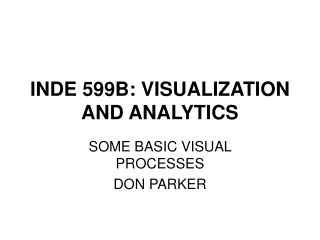
Visualization Knowledge ( VisKo ): Leveraging the Semantic Web to Support Visualization. University of Texas at El Paso Computer Science. Velocity Model Visualization. A set of isosurfaces extracted from a seismic velocity model Covers a region in southern New Mexico. 3 km/s. Depth.

E N D
Visualization Knowledge (VisKo): Leveraging the Semantic Web to Support Visualization University of Texas at El Paso Computer Science
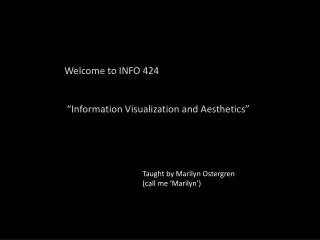
Velocity Model Visualization • A set of isosurfaces • extracted from a seismic velocity model • Covers a region in southern New Mexico 3 km/s Depth 8 km/s
Visualizing the Velocity Model • Generated by custom Java application • relied on Visualization Toolkit (VTK) for rendering • VTK was developed for rendering 3D visualizations • VTK is supported by Sandia, Los Alamos, ARL, and others • Writing a custom visualization application: • may rely on third party package to support rendering • may need to perform some transformations on input dataset before rendering
Program For Velocity Visualization vtkImageReaderrdr= new vtkImageReader(); rdr.SetFileName(inputDatasetFilePath); rdr.SetDataScalarTypeToUnsignedShort(); rdr.SetDataByteOrderToLittleEndian(); rdr.SetFileDimensionality(3); rdr.SetDataOrigin(0,0,0); rdr.SetDataSpacing(1,1,1); rdr.SetDataExtent(0,230,0,25,0,68); rdr.SetNumberOfScalarComponents(1); rdr.FileLowerLeftOn(); rdr.Update(); vtkContourFiltercontours = new vtkContourFilter(); contours.SetInput(rdr.GetOutput()); contours.GenerateValues(35,0.0,9000.0); vtkPolyDataMappercontMapper = new vtkPolyDataMapper(); contMapper.SetInput(contours.GetOutput()); contMapper.SetScalarRange(0.0,9000.0); • vtkActorcontActor = new vtkActor(); • contActor.SetMapper(contMapper); • contActor.RotateX(105); • vtkRenderer ren1 = new vtkRenderer(); • ren1.AddActor(contActor); • ren1.AddActor2D(outlineActor); • ren1.SetBackground(1,1,1); • vtkRenderWindowrenWin = new vtkRenderWindow(); • renWin.SetOffScreenRendering(1); • renWin.AddRenderer(ren1); • renWin.SetSize(300,300); • renWin.Render(); • vtkJPEGWriterimg= new vtkJPEGWriter(); • img.SetInputConnection(renWin.GetOutputPort()); • img.SetFileName(outputDatasetFilePath); • img.SetQuality(100);
What Information is Needed? • Regarding visualization, users need to know: • What view suits their data (e.g., contours, map, surfaces) • What properties should the view exhibit (e.g., orientation, projection, color, size) • Regarding datasets, users need to know: • The semantic type of the data (e.g., gravity, velocity) • The type of data helps with setting parameter arguments • The format the data is encoded in (e.g., netCDF, ESRI)
What Information is Needed? • Regarding third party rendering software: • Can it generate the required renderings? • Can it ingest my data in the format it resides in? • Does it satisfy my performance requirements? • What language can I use to interface with it? • What dependent packages do I need to install?
Where to Get Information • Regarding the view: • some user may prefer to see isosurfaces whereas another user prefers volume renderings (its personal) • Regarding the data: • provenance may declare what format and type of dataset • Provenance Markup Language (PML) has fields for recording both type and format • Regarding the third party rendering software: • Reading, reading, and more reading • May have a visualization expert assist you
Writing the Program • Once you have answers for the previous questions, you can begin coding • Some portion of the code will transform input datasets into formats that can be rendered • Most renderers format specific (exception Protovis) • The rest of the code will: • Gather suitable arguments for the rendering • Invoking the renderer with the arguments
Overview of the Visualization Program • The visualization program that generated the velocity model visualization: • Relies on VTK for rendering • Renders the data as isosurfaces • Ingests data in format binaryFloatArray • transforms binaryFloatArray to VTKImageData • Ingests data of type 3DVelocityModel • Is a serial application • Is written in Java
Presentation Overview • Toolkits and Visualization Pipelines • Visualization Query • Automated Generation of Visualization pipelines • Ontological Description of Visualization Pipelines • Execution of Visualization Pipelines • Giovanni and VisKo
Visualization Toolkits • Visualization Toolkit (VTK) was used to render the velocity visualization • VTK is a toolkit that provides functions such as: • Filtering • Gridding/interpolating • Mapping (i.e., transform data into views like isosurfaces) • Rendering the views • Functions are referred to as operators • Generic mapping tools (GMT): 60 operators • VTK: hundreds of operators
Visualization Pipeline Model • VTK requires that users write pipelines • the output of an operator feeds into the operator next in the pipeline sequence • first operator in pipeline is usually data reader • final operator in pipeline is usually renderer • Thus the Java program that visualizes the velocity model can be seen as a pipeline of VTK operators • It is up to the users to write these pipelines…
VTK Java Pipeline For Velocity Model vtkImageReaderrdr= new vtkImageReader(); rdr.SetFileName(inputDatasetFilePath); rdr.SetDataScalarTypeToUnsignedShort(); rdr.SetDataByteOrderToLittleEndian(); rdr.SetFileDimensionality(3); rdr.SetDataOrigin(0,0,0); rdr.SetDataSpacing(1,1,1); rdr.SetDataExtent(0,230,0,25,0,68); rdr.SetNumberOfScalarComponents(1); rdr.FileLowerLeftOn(); rdr.Update(); vtkContourFiltercontours = new vtkContourFilter(); contours.SetInput(rdr.GetOutput()); contours.GenerateValues(35,0.0,9000.0); vtkPolyDataMappercontMapper = new vtkPolyDataMapper(); contMapper.SetInput(contours.GetOutput()); contMapper.SetScalarRange(0.0,9000.0); • vtkActorcontActor = new vtkActor(); • contActor.SetMapper(contMapper); • contActor.RotateX(105); • vtkRenderer ren1 = new vtkRenderer(); • ren1.AddActor(contActor); • ren1.AddActor2D(outlineActor); • ren1.SetBackground(1,1,1); • vtkRenderWindowrenWin = new vtkRenderWindow(); • renWin.SetOffScreenRendering(1); • renWin.AddRenderer(ren1); • renWin.SetSize(300,300); • renWin.Render(); • vtkJPEGWriterimg= new vtkJPEGWriter(); • img.SetInputConnection(renWin.GetOutputPort()); • img.SetFileName(outputDatasetFilePath); • img.SetQuality(100);
Pipeline of Visualization Operators Op 5 vtkImageReaderrdr= new vtkImageReader(); rdr.SetFileName(inputDatasetFilePath); rdr.SetDataScalarTypeToUnsignedShort(); rdr.SetDataByteOrderToLittleEndian(); rdr.SetFileDimensionality(3); rdr.SetDataOrigin(0,0,0); rdr.SetDataSpacing(1,1,1); rdr.SetDataExtent(0,230,0,25,0,68); rdr.SetNumberOfScalarComponents(1); rdr.FileLowerLeftOn(); rdr.Update(); vtkContourFiltercontours = new vtkContourFilter(); contours.SetInput(rdr.GetOutput()); contours.GenerateValues(35,0.0,9000.0); vtkPolyDataMappercontMapper = new vtkPolyDataMapper(); contMapper.SetInput(contours.GetOutput()); contMapper.SetScalarRange(0.0,9000.0); • vtkActorcontActor = new vtkActor(); • contActor.SetMapper(contMapper); • contActor.RotateX(105); • vtkRenderer ren1 = new vtkRenderer(); • ren1.AddActor(contActor); • ren1.AddActor2D(outlineActor); • ren1.SetBackground(1,1,1); • vtkRenderWindowrenWin = new vtkRenderWindow(); • renWin.SetOffScreenRendering(1); • renWin.AddRenderer(ren1); • renWin.SetSize(300,300); • renWin.Render(); • vtkJPEGWriterimg= new vtkJPEGWriter(); • img.SetInputConnection(renWin.GetOutputPort()); • img.SetFileName(outputDatasetFilePath); • img.SetQuality(100); Op 1 Op 6 Op 2 Op 7 Op 3 Op 8
Different Types of Operators Op 5 Transformer vtkImageReaderrdr= new vtkImageReader(); rdr.SetFileName(inputDatasetFilePath); rdr.SetDataScalarTypeToUnsignedShort(); rdr.SetDataByteOrderToLittleEndian(); rdr.SetFileDimensionality(3); rdr.SetDataOrigin(0,0,0); rdr.SetDataSpacing(1,1,1); rdr.SetDataExtent(0,230,0,25,0,68); rdr.SetNumberOfScalarComponents(1); rdr.FileLowerLeftOn(); rdr.Update(); vtkContourFiltercontours = new vtkContourFilter(); contours.SetInput(rdr.GetOutput()); contours.GenerateValues(35,0.0,9000.0); vtkPolyDataMappercontMapper = new vtkPolyDataMapper(); contMapper.SetInput(contours.GetOutput()); contMapper.SetScalarRange(0.0,9000.0); • vtkActorcontActor = new vtkActor(); • contActor.SetMapper(contMapper); • contActor.RotateX(105); • vtkRenderer ren1 = new vtkRenderer(); • ren1.AddActor(contActor); • ren1.AddActor2D(outlineActor); • ren1.SetBackground(1,1,1); • vtkRenderWindowrenWin = new vtkRenderWindow(); • renWin.SetOffScreenRendering(1); • renWin.AddRenderer(ren1); • renWin.SetSize(300,300); • renWin.Render(); • vtkJPEGWriterimg= new vtkJPEGWriter(); • img.SetInputConnection(renWin.GetOutputPort()); • img.SetFileName(outputDatasetFilePath); • img.SetQuality(100); Op 1 Transformer Op 6 Renderer View Mapper Op 2 Transformer Op 7 Transformer Op 3 Op 8 Transformer
Operators are Parameterized Op 5 P1 vtkImageReaderrdr= new vtkImageReader(); rdr.SetFileName(inputDatasetFilePath); rdr.SetDataScalarTypeToUnsignedShort(); rdr.SetDataByteOrderToLittleEndian(); rdr.SetFileDimensionality(3); rdr.SetDataOrigin(0,0,0); rdr.SetDataSpacing(1,1,1); rdr.SetDataExtent(0,230,0,25,0,68); rdr.SetNumberOfScalarComponents(1); rdr.FileLowerLeftOn(); rdr.Update(); vtkContourFiltercontours = new vtkContourFilter(); contours.SetInput(rdr.GetOutput()); contours.GenerateValues(35,0.0,9000.0); vtkPolyDataMappercontMapper = new vtkPolyDataMapper(); contMapper.SetInput(contours.GetOutput()); contMapper.SetScalarRange(0.0,9000.0); • vtkActorcontActor = new vtkActor(); • contActor.SetMapper(contMapper); • contActor.RotateX(105); • vtkRenderer ren1 = new vtkRenderer(); • ren1.AddActor(contActor); • ren1.AddActor2D(outlineActor); • ren1.SetBackground(1,1,1); • vtkRenderWindowrenWin = new vtkRenderWindow(); • renWin.SetOffScreenRendering(1); • renWin.AddRenderer(ren1); • renWin.SetSize(300,300); • renWin.Render(); • vtkJPEGWriterimg= new vtkJPEGWriter(); • img.SetInputConnection(renWin.GetOutputPort()); • img.SetFileName(outputDatasetFilePath); • img.SetQuality(100); P7 Op 1 P2 Op 6 P3 P8 P4 Op 2 Op 7 P9 P5 Op 3 Op 8 P6
What Kind of Skills are Currently required by a user? • Knows about different views • Knows what toolkits support a particular view • Knows what toolkits operate on a particular data • Knows how to install a visualization toolkit • Knows what language the toolkit is built on • Knows what operators need to compose a pipeline • Knows suitable arguments for the operators • Knows how to develop software
What Kind of Skills are Currently required by a user? • Knows about different views • Knows what toolkits support a particular view • Knows what toolkits operate on a particular data • Knows how to install a visualization toolkit • Knows what language the toolkit is built on • Knows what operators need to compose a pipeline • Knows suitable arguments for the operators • Knows how to develop software scientist Visualization Expert Engineer
Presentation Overview • Toolkits and Visualization Pipelines • Visualization Query • Automated Generation of Visualization pipelines • Ontological Description of Visualization Pipelines • Execution of Visualization Pipelines • Giovanni and VisKo
Declarative Requests • Many user skills needed to visualize data • Aside from cognitive aspects of visualization, a large part of the problem is engineering • Stems from fact that we generate visualizations imperatively (i.e., write code) Can we provide a means for users to generate visualizations declaratively (i.e., specify what visualization they want without having to code)?
Visualization Query • The velocity model visualization was actually a result of a visualization query Requested Visualization Desired View URL of Data to visualize Format of dataset Semantic Type of dataset WDO types (UTEP) Parameter Argument Viewer
Visualization Queries and SQL • Visualization queries mirror SQL queries • query request is specified declaratively • request is then translated into a query plan • query plan computes the result requested by the query • Information specified in visualization queries is used to derive pipelines rather than query plans • The pipeline in turn generates the visualization requested in the query
Visualization Query Challenges What kind of knowledge is needed to generate pipelines that answer visualization queries? What infrastructure can leverage the knowledge to support the generation and execution of the pipelines?
VisKo Project Claims • VisKo supplements user skills with visualization knowledge to compose pipelines • VisKo is a framework for: • Encoding user skills into visualization knowledge • managing visualization knowledge • Executing pipelines
Old Way vs VisKo vtkImageReaderrdr= new vtkImageReader(); rdr.SetFileName(inputDatasetFilePath); rdr.SetDataScalarTypeToUnsignedShort(); rdr.SetDataByteOrderToLittleEndian(); rdr.SetFileDimensionality(3); rdr.SetDataOrigin(0,0,0); rdr.SetDataSpacing(1,1,1); rdr.SetDataExtent(0,230,0,25,0,68); rdr.SetNumberOfScalarComponents(1); rdr.FileLowerLeftOn(); rdr.Update(); vtkContourFiltercontours = new vtkContourFilter(); contours.SetInput(rdr.GetOutput()); contours.GenerateValues(35,0.0,9000.0); vtkPolyDataMappercontMapper = new vtkPolyDataMapper(); contMapper.SetInput(contours.GetOutput()); contMapper.SetScalarRange(0.0,9000.0);
Presentation Overview • Toolkits and Visualization Pipelines • Visualization Query • Automated Generation of Visualization pipelines • Ontological Description of Visualization Pipelines • Execution of Visualization Pipelines • Giovanni and VisKo
A Pipeline Synthesized by VisKo operators data flow
VisKo Pipeline Composition • The query tells the system: • the input format • the target view • From target view: • Identify operator that generates view (i.e. view mapper) • From operator: • identify format it operates on (i.e., target format) • Find sequence of operators that transforms the input format to target format
Information From Query Binary Float Array hasFormat hasView Isosurfaces view Dataset Information from Query
Knowledge about Toolkit Operators vtk Poly Data vtk Image Data Binary Float Array hasFormat out format in format vtk Contour Filter hasView generatesView Isosurfaces view Dataset Knowledge about toolkit operators Information from Query
The Knowledge is Linked vtk Poly Data vtk Image Data Binary Float Array hasFormat out format Both query and operator reference “isosurfaces” in format vtk Contour Filter hasView generatesView Isosurfaces view Dataset Knowledge about toolkit operators Information from Query
Format Transformation? vtk Poly Data vtk Image Data Binary Float Array hasFormat out format in format vtk Contour Filter hasView generatesView Isosurfaces view Dataset Knowledge about toolkit operators Information from Query
Required Pipeline vtk Poly Data vtk Image Data Binary Float Array hasFormat out format in format vtk Contour Filter hasView generatesView Isosurfaces view Dataset Knowledge about toolkit operators Information from Query
Multiple Results Example Visualization Query Input format is ESRI Gridded Data is of type Gravity Data No view specified!
Multiple Results Example VisKo was able to generate three different pipelines, given the query and visualization knowledge currently loaded Query Results
Multiple Visualizations Example Query Results
Multiple Visualizations Example Visualization Query PDF vs PNG Format Query Results View was left unspecified in query, so system visualized data by any means
Composition by Rules • Pipeline composition is actually derived through application of rules • rules are applied to statements comprising our visualization knowledge • rules are simple horn clauses • Rules are not described in this seminar • Before we can apply rules, we need to know what statements comprise our knowledge base
Presentation Overview • Toolkits and Visualization Pipelines • Visualization Query • Automated Generation of Visualization pipelines • Ontological Description of Visualization Pipelines • Execution of Visualization Pipelines • Giovanni and VisKo
VisKo Visualization Language • VisKo provides a language to describe operators and how they can be composed into pipelines • The language’s expressivity is focused on describing: • Views and view properties • Different operator types • Parameters associated with operators • The language is defined by ontologies encoded in Ontology Web Language (OWL)
VisKo Language Layers • The VisKo language encompasses three different ontologies to describe toolkit operators from different perspectives Visko-Views (views and properties) Visualization Visko-Operator (operator function + composition rules) Spectrum Visko-Service (services, parameters, and types) Execution
Encoding Velocity Model View • Velocity model is visualized as a set of isosurfaces, so this view is defined as a set of ESIP surfaces • We need to describe this resource isosurfaces in terms of the ontology: Isosurfaces isa Surfaces Isosurfaces isa Geometry Isosurfaces isaAtomicView Isosurfaces isa View Isosurfaces description Note: VisKo relies on Resource Document Framework (RDF) for encoding statements
Encoding Velocity Model Operator • A contouring operator generated the isosurfaces • The contouring operator • operated on data in format 3DImageData • generated the view isosurfaces • output plot in format PolyData contouringOperatorisa Mapper contouringOperatoroperatesOn 3DImageData contouringOperatortransformsToPolyData contouringOperatormapsTo isosurfaces vtkContourFilter description Note: contouring operator is conceptual and cannot be executed
Encoding Velocity Model Service • The contouring operator was implemented by the VTKContourFilter service vtkContourFilterisaService vtkContourFilterimplements contouring vtkContourFiltersupportedBy VTK vtkContourFilterhasInputcontourSpacing vtkContourFilterhasInputnumberOfContours vtkContourFilterhasGroundingwsdlGrounding VisKo-Service vtkContourFilter description OWL-S Executable VisKo service implements operator contouring
Presentation Overview • Toolkits and Visualization Pipelines • Visualization Query • Automated Generation of Visualization pipelines • Ontological Description of Visualization Pipelines • Execution of Visualization Pipelines • Giovanni and VisKo
Pipeline Execution • VisKo infrastructureis also responsible for executing the derived pipelines • Pipeline Execution Requirements • All operators must have a Web service implementation • Any operator that does not have a service implementation cannot be executed, and neither can its parent pipeline
Visualization Language Layer Cake • VisKo language does not express execution details • VisKo is therefore is built on other languages/standards that specialize in execution of services and pipelines VisKo Visualization Language SEMANTIC OWL-S Semantic Web Services WSDL SYNTACTIC Web Services GMT VTK IDL Executable Toolkit Operators PROGRAMING LANGUAGE Execution layers
Presentation Overview • Toolkits and Visualization Pipelines • Visualization Query • Automated Generation of Visualization pipelines • Ontological Description of Visualization Pipelines • Execution of Visualization Pipelines • Giovanni and VisKo
Giovanni From GrADS to NCL • Had to rework Giovanni when NCL was introduced • Workflow may have needed to be modified: • Added operators to convert to new format required by new operator • Configure or change actor to work with protocol of new visualization operator • Input new parameters to the visualization module