Download
1 / 2
20 likes | 126 Views
Boundary Layer Parameters as a Function of Soil Moisture Content. Matthew Bloemer, FSU Department of Meteorology MET 6480: Planetary Boundary Layers; Semester Project Presentation 12-13-2006. Overview

E N D
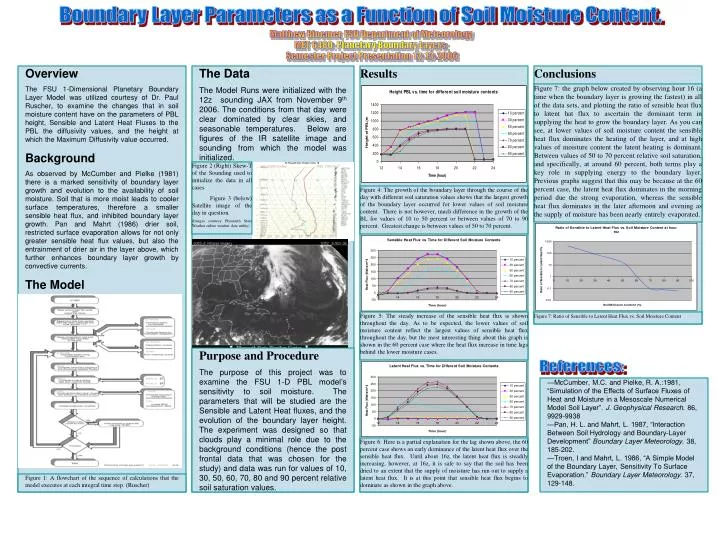
Boundary Layer Parameters as a Function of Soil Moisture Content. Matthew Bloemer, FSU Department of Meteorology MET 6480: Planetary Boundary Layers; Semester Project Presentation 12-13-2006 Overview The FSU 1-Dimensional Planetary Boundary Layer Model was utilized courtesy of Dr. Paul Ruscher, to examine the changes that in soil moisture content have on the parameters of PBL height, Sensible and Latent Heat Fluxes to the PBL the diffusivity values, and the height at which the Maximum Diffusivity value occurred. Background As observed by McCumber and Pielke (1981) there is a marked sensitivity of boundary layer growth and evolution to the availability of soil moisture. Soil that is more moist leads to cooler surface temperatures, therefore a smaller sensible heat flux, and inhibited boundary layer growth. Pan and Mahrt (1986) drier soil, restricted surface evaporation allows for not only greater sensible heat flux values, but also the entrainment of drier air in the layer above, which further enhances boundary layer growth by convective currents. The Model The Data The Model Runs were initialized with the 12z sounding JAX from November 9th 2006. The conditions from that day were clear dominated by clear skies, and seasonable temperatures. Below are figures of the IR satellite image and sounding from which the model was initialized. Results Conclusions Figure 7: the graph below created by observing hour 16 (a time when the boundary layer is growing the fastest) in all of the data sets, and plotting the ratio of sensible heat flux to latent hat flux to ascertain the dominant term in supplying the heat to grow the boundary layer. As you can see, at lower values of soil moisture content the sensible heat flux dominates the heating of the layer, and at high values of moisture content the latent heating is dominant. Between values of 50 to 70 percent relative soil saturation, and specifically, at around 60 percent, both terms play a key role in supplying energy to the boundary layer. Previous graphs suggest that this may be because at the 60 percent case, the latent heat flux dominates in the morning period due the strong evaporation, whereas the sensible heat flux dominates in the later afternoon and evening as the supply of moisture has been nearly entirely evaporated. Figure 2 (Right) Skew-T of the Sounding used to initialize the data in all cases Figure 3 (below) Satellite image of the day in question. (Images courtesy Plymouth State Weather online weather data utility) Figure 4: The growth of the boundary layer through the course of the day with different soil saturation values shows that the largest growth of the boundary layer occurred for lower values of soil moisture content. There is not however, much difference in the growth of the BL for values of 10 to 50 percent or between values of 70 to 90 percent. Greatest change is between values of 50 to 70 percent. Figure 5: The steady increase of the sensible heat flux is shown throughout the day. As to be expected, the lower values of soil moisture content reflect the largest values of sensible heat flux throughout the day, but the most interesting thing about this graph is shown in the 60 percent case where the heat flux increase in time lags behind the lower moisture cases. Figure 7: Ratio of Sensible to Latent Heat Flux vs. Soil Moisture Content Purpose and Procedure The purpose of this project was to examine the FSU 1-D PBL model’s sensitivity to soil moisture. The parameters that will be studied are the Sensible and Latent Heat fluxes, and the evolution of the boundary layer height. The experiment was designed so that clouds play a minimal role due to the background conditions (hence the post frontal data that was chosen for the study) and data was run for values of 10, 30, 50, 60, 70, 80 and 90 percent relative soil saturation values. References: —McCumber, M.C. and Pielke, R. A.:1981, “Simulation of the Effects of Surface Fluxes of Heat and Moisture in a Mesoscale Numerical Model Soil Layer”. J. Geophysical Research. 86, 9929-9938 —Pan, H. L. and Mahrt, L. 1987, “Interaction Between Soil Hydrology and Boundary-Layer Development” Boundary Layer Meteorology. 38, 185-202. —Troen, I and Mahrt, L. 1986, “A Simple Model of the Boundary Layer, Sensitivity To Surface Evaporation.” Boundary Layer Meteorology. 37, 129-148. Figure 6: Here is a partial explanation for the lag shown above, the 60 percent case shows an early dominance of the latent heat flux over the sensible heat flux. Until about 16z, the latent heat flux is steadily increasing, however, at 16z, it is safe to say that the soil has been dried to an extent that the supply of moisture has run out to supply a latent heat flux. It is at this point that sensible heat flux begins to dominate as shown in the graph above. Figure 1: A flowchart of the sequence of calculations that the model executes at each integral time step. (Ruscher)
Boundary Layer Parameters as a Function of Soil Moisture Content. Matthew Bloemer, FSU Department of Meteorology MET 6480: Planetary Boundary Layers; Semester Project Presentation 12-13-2006