Download

1 / 26
260 likes | 275 Views
Assurance of Student Learning Day. March 29, 2019 Bob Blankenberger Public Administration. Overview. Describe how Public Administration made changes due to our accreditation self-study Network of Schools of Public Policy, Affairs and Administration (NASPAA) accreditation

E N D
Assurance of Student Learning Day March 29, 2019 Bob Blankenberger Public Administration
Overview • Describe how Public Administration made changes due to our accreditation self-study • Network of Schools of Public Policy, Affairs and Administration (NASPAA) accreditation • Review of outcomes aligned to NASPAA standards • Curriculum Map • Collecting, aggregating, and analyzing data • Making data-informed departmental decisions based on the data analysis
MPA Program Learning Outcomes • The MPA program’s goals and objectives are based on the NASPAA core competencies: • Lead and manage in public governance • Participate in and contribute to the public policy process • Analyze, synthesize, think critically, solve problems, and make decisions • Articulate and apply a public service perspective • Communicate and interact productively with a diverse and changing workforce and citizenry.
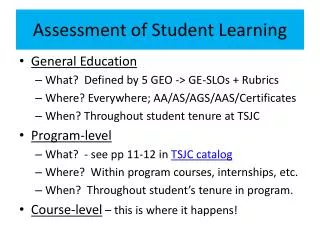
MPA Program Learning Outcomes • Graduates of the MPA degree program will be able to understand and demonstrate knowledge and skills in the following competencies: • Lead and manage in public governance • Communicate in a clear and concise manner • Apply relevant theories, knowledge, and skills to effectively manage resources and programs • Participate in and contribute to the public policy process • Describe the public policy process and the role of the various participants and stakeholders • Identify problems, frame the issues, and identify and evaluate alternatives for addressing a problem • Analyze, synthesize, think critically, solve problems, and make decisions • Demonstrate the ability to collect, analyze, and interpret data for use in decision making, and drawing conclusions • Critically read and apply findings from studies and reports • Articulate and apply a public service perspective • Articulate the importance of and operate in a manner that facilitates democracy, equity, transparency, efficiency, and ethics • Communicate and interact productively with a diverse and changing workforce and citizenry. • Demonstrate a sensitivity of and respect for differences in culture
Input monitoring • Department strategic planning in preparation for NASPAA self-study • Curriculum alignment with NASPAA competency revisions • Advisory committee feedback • NASPAA annual conference • MPA curriculum revision • Reduction from 4 hour to 3 hour courses • Addition of policy class and information for decision making course • Diversity competency across multiple courses
Capstone Matrix • Indirect assessment measure • Portfolio reflection paper includes a competency self-assessment • Look for patterns of competency coverage
Capstone Matrix • Portfolio reflection
Diversity Assessment Measure • Direct measure of learning from a student work product • A portion of article analysis assignmentfrom PAD 506 • Discuss at least two examples of differential impact on baccalaureate completion outcomes revealed by the data analysis • Blankenberger, et al. (2017). Diverse students, high school factors, and completion agenda goals: An analysis of the Illinois class of 2003. Education and Urban Society 49(5), 518-545. • Provide an example of how that information could be used in a policy analysis addressing the goal to improve baccalaureate completion.
Diversity Assessment Measure • Course issue? Program issue? • Assessment issue? • Covered better in other courses – assessment moved to 505
Review of Research Strategy • Selection of analysis technique depends on the variables and available data • When the DV is ordinal, interval, or ratio • Some use a simple t-test to compare group means • Assumption issues with ordinal • e.g., mean scores for group 1 vs group 2 • Use a chi-square (χ2) to tell whether a sample population matches a theoretical one • i.e., do the proportions match? • e.g., control/treatment group; online/on ground; traditional/six week delivery; un/employed status Source: Gravezetter, F. J. & Forzano, L. B. (2009). Research methods for the behavioral sciences, 3rd ed. Belmont, CA: Wadsworth.
Review of Research Strategy • Selection depends on the variables and available data • Depending on skills and software access • When the DV is nominal or ordinal • Use a non-parametric test to avoid violating assumptions about the data (de Winter & Dodou, 2010) • e.g., with Likert scaled data or rubric based scores • Mann-Whitney U if the comparison groups are different – online/on ground. • Kruskal-Wallis H test for 3+ groups • Wilcoxon Signed Rank Test (WSRT) if testing the same group - pre/post testing. Sources: Gravezetter, F. J. & Forzano, L. B. (2009). Research methods for the behavioral sciences, 3rd ed. Belmont, CA: Wadsworth. de Winter, J. C., & Dodou, D. (2010). Five-point Likert items: T test versus Mann-Whitney-Wilcoxon. Practical Assessment, Research & Evaluation, 15(11), 1-12.
Ethics and the Public Service Assessment • Public Service Reflection paper assignment description for PAD571 – direct assessment • This assignment is a reflective essay answering the question – what is the role of ethics and the public service perspective for public administrators? • To help frame the assignment – 2 readings (Lewis, 2006; Svara, 2014). Apply experience and other coursework.
Ethics and the Public Service Assessment • Create dataset • Student identifier, semester, demographic, entering gpa, modality, assessment scores • Simple t-test on ground vs online scores • On-ground mean=2.132, online = 2.233 • Assumption test, p=.817 so two groups have equal variances • Excel command – ftest(array1, array2) • p=.326 so no significant difference between groups • Excel command - ttest(array1,array2,2,2) • Indicates whether the means of the two groups are different
Effect Size • Effect size shows the magnitude of difference between group scores. • small (d = 0.2), medium (d = 0.5), and large (d = 0.8) (Cohen, 1998) • Cohen's d = (M2 - M1) ⁄ SDpooled • Out t-test example • Cohen's d = (2.233 - 2.132) ⁄ 0.415813 = 0.242898 • Online calculators: • https://www.socscistatistics.com/effectsize/default3.aspx • http://www.campbellcollaboration.org/escalc/html/EffectSizeCalculator-SMD1.php • https://www.psychometrica.de/effect_size.html
Between-subjects design: Comparing proportional data for two or more groups • When the dependent variable is a nominal or ordinal measure • e.g., rubric score data • Compare proportions between groups using a chi-square test (χ2) to tell whether the sample population matches the theoretical one • Do the proportions match? Source: Gravezetter, F. J. & Forzano, L. B. (2009). Research methods for the behavioral sciences, 3rd ed. Belmont, CA: Wadsworth.
Public Service Assessment Chi-Square example • Use public service rubric scores about program standards • Compare online and on ground • Not statistically significant • so on ground and online student scores are not significantly different
Review of Research Strategy • If you would like to add covariates • Use linear regression (R2) when the variables are interval or ratio • Use ordinal logistic regression • IV is nominal, ordinal or interval/ratio, • DV is ordinal • e.g., rubric scores, Likert scaled survey results • Add covariates – GPA, age, et al.
Review of Research Strategy • ANOVA or MANOVA • With more than 2 groups • IV is nominal or ordinal • DV is interval or ratio • e.g., online/ on ground/mixed modality as an IV, and test scores as the DV
Mann-Whitney U example in SPSS 60 students – 27 on ground, 33 online Ordinal rubric data scored 1-5 Mean ranks similar p=0.415, so no statistically significant differences
References: Berk, R. A., & Rossi, P. H. (1990) Thinking about program evaluation. Newbury Park, CA: Sage. Cantrell-Bruce, T. & Blankenberger, B. (2015). Seeing clearly: Measuring skill sets that address the “blurred boundaries” of nonprofit education. Journal of Public Affairs Education, 21(3), 367-380 de Winter, J. C., & Dodou, D. (2010). Five-point Likert items: T test versus Mann-Whitney-Wilcoxon. Practical Assessment, Research & Evaluation, 15(11), 1-12. Gravezetter, F. J. & Forzano, L. B. (2009). Research methods for the behavioral sciences, 3rd ed. Belmont, CA: Wadsworth. http://www.socialresearchmethods.net/kb/measlevl.php Rossi, P. H., Lipsey, M. W., & Freeman, H. E. (2003). Evaluation: A systematic approach. Sage publications. Sylvia, R. D., & Sylvia, K. M. (2012). Program planning and evaluation for the public manager. 4th ed. Long Grove, IL:Waveland Press, Inc.