Download
1 / 1
10 likes | 204 Views
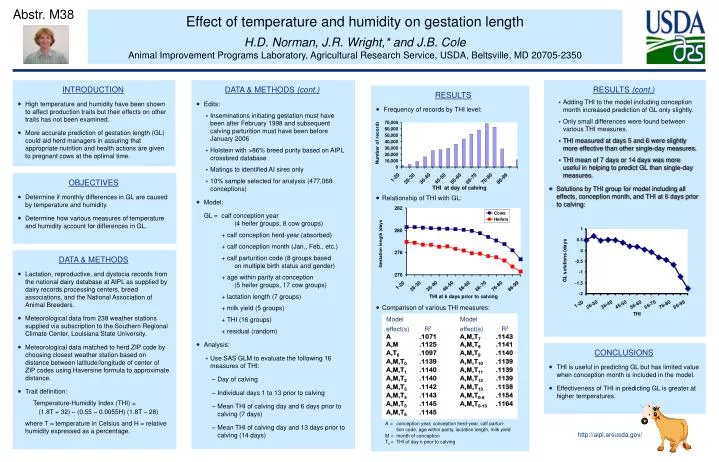
Abstr. M38. Effect of temperature and humidity on gestation length H.D. Norman, J.R. Wright,* and J.B. Cole Animal Improvement Programs Laboratory, Agricultural Research Service, USDA, Beltsville, MD 20705-2350. INTRODUCTION

E N D
Abstr. M38 Effect of temperature and humidity on gestation length H.D. Norman, J.R. Wright,* and J.B. Cole Animal Improvement Programs Laboratory, Agricultural Research Service, USDA, Beltsville, MD 20705-2350 INTRODUCTION • High temperature and humidity have been shown to affect production traits but their effects on other traits has not been examined. • More accurate prediction of gestation length (GL) could aid herd managers in assuring that appropriate nutrition and health actions are given to pregnant cows at the optimal time. DATA & METHODS (cont.) • Edits: • Inseminations initiating gestation must have been after February 1998 and subsequent calving parturition must have been before January 2006 • Holstein with >86% breed purity based on AIPL crossbred database • Matings to identified AI sires only • 10% sample selected for analysis (477,068 conceptions) • Model: GL = calf conception year • (4 heifer groups, 8 cow groups) • + calf conception herd-year (absorbed) • + calf conception month (Jan., Feb., etc.) • + calf parturition code (8 groups based • on multiple birth status and gender) • + age within parity at conception • (5 heifer groups, 17 cow groups) • + lactation length (7 groups) • + milk yield (5 groups) • + THI (16 groups) • + residual (random) • Analysis: • Use SAS GLM to evaluate the following 16 measures of THI: • Day of calving • Individual days 1 to 13 prior to calving • Mean THI of calving day and 6 days prior to calving (7 days) • Mean THI of calving day and 13 days prior to calving (14 days) RESULTS (cont.) • Adding THI to the model including conception month increased prediction of GL only slightly. • Only small differences were found between various THI measures. • THI measured at days 5 and 6 were slightly more effective than other single-day measures. • THI mean of 7 days or 14 days was more useful in helping to predict GL than single-day measures. • Solutions by THI group for model including all effects, conception month, and THI at 6 days prior to calving: RESULTS (cont.) • Adding THI to the model including conception month increased prediction of GL only slightly. • Only small differences between were found between various THI measures. • THI measured at days 5 and 6 were slightly more effective than other single-day measures. • THI mean of 7 days or 14 days was more useful in helping to predict GL than single-day measures. • Solutions by THI group for model including all effects, conception month, and THI at 6 days prior to calving: RESULTS • Frequency of records by THI level: • Relationship of THI with GL: • Comparison of various THI measures: • A = conception year, conception herd-year, calf parturi- tion code, age within parity, lactation length, milk yield M = month of conception Tn = THI of day n prior to calving OBJECTIVES • Determine if monthly differences in GL are caused by temperature and humidity. • Determine how various measures of temperature and humidity account for differences in GL. DATA & METHODS • Lactation, reproductive, and dystocia records from the national dairy database at AIPL as supplied by dairy records processing centers, breed associations, and the National Association of Animal Breeders. • Meteorological data from 238 weather stations supplied via subscription to the Southern Regional Climate Center, Louisiana State University. • Meteorological data matched to herd ZIP code by choosing closest weather station based on distance between latitude/longitude of center of ZIP codes using Haversine formula to approximate distance. • Trait definition: Temperature-Humidity Index (THI) = (1.8T + 32) – (0.55 – 0.0055H) (1.8T – 28) where T = temperature in Celsius and H = relative humidity expressed as a percentage. Model Model effect(s) R2 effect(s) R2 A .1071 A,M,T7 .1143 A,M .1125 A,M,T8 .1141 A,T6 .1097 A,M,T9 .1140 A,M,T0 .1139 A,M,T10 .1139 A,M,T1 .1140 A,M,T11 .1139 A,M,T2 .1140 A,M,T12 .1139 A,M,T3 .1142 A,M,T13 .1138 A,M,T4 .1143 A,M,T0-6 .1154 A,M,T5 .1145 A,M,T0-13 .1164 A,M,T6 .1145 CONCLUSIONS • THI is useful in predicting GL but has limited value when conception month is included in the model. • Effectiveness of THI in predicting GL is greater at higher temperatures. http://aipl.arsusda.gov/