Download
1 / 18
180 likes | 337 Views
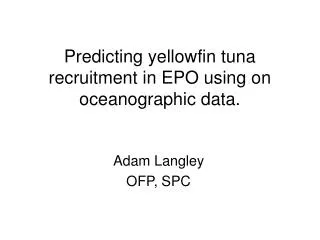
A random effects meta-population model of yellowfin tuna in the eastern Pacific Ocean. Mark Maunder IATTC. Motivation. Account for the spatial expansion of the longline and purse seine fisheries Use a population dynamics model to smooth out CPUE and fill in missing years. Basic model.

E N D
A random effects meta-population model of yellowfin tuna in the eastern Pacific Ocean Mark Maunder IATTC
Motivation • Account for the spatial expansion of the longline and purse seine fisheries • Use a population dynamics model to smooth out CPUE and fill in missing years
Basic model • Treat each 5x5° square as a separate area • Share information about parameters among areas • Ignore movement • Use a simple model (P-T30%)
P-T30% P-T30%: m = 0.681
ADMB Random effects • ADMB now has random effects • Use Laplace approximation or importance sampling • Can integrate across random effects to create true likelihood • May have memory problems
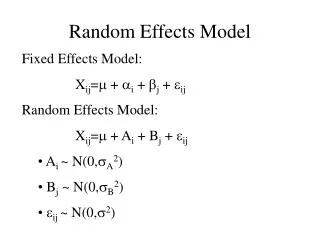
Parameter constraints • m: Bmsy/B0=0.3 • q: provides information on the relationship of absolute biomass among areas • B0: may be the parameter that most varies • r: may be similar among areas • σ: may be similar among stocks
Simple model • m: Bmsy/B0=0.3 • q: constant • B0: very variable (cv=0.6) • r: fixed at 0.3 • σ: constant and fixed
Issues • Which areas to include • Some only have a few years of catch • Sum of catch over all years > 10,000t • Initial values for B0 • Use • Effort leves • >= 5 days fished • Weight –ln(L) by square-root of effort
Developments • Quarterly model • Make random effects use spatial correlation • Advection and diffusion • Environmental variation forced shifts in abundance • Include other data (tagging and length-frequency)