Download
1 / 9
90 likes | 103 Views
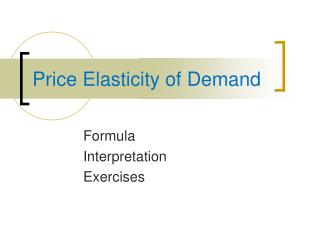
AP Microeconomics. Price Elasticity of Demand. Chapter 5. D 1. D 1. D 1. Slope of Demand Curves. All demand curves do not have the same slope Slope indicates responsiveness of buyers to a change in price. Which demand curve is most sensitive to price changes?. Price. Price.

E N D
AP Microeconomics Price Elasticity of Demand Chapter 5
D1 D1 D1 Slope of Demand Curves • All demand curves do not have the same slope • Slope indicates responsiveness of buyers to a change in price Which demand curve is most sensitive to price changes? Price Price Price Qty Qty Qty
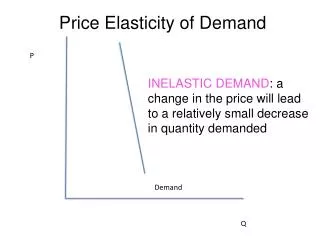
ELASTICITY OF DEMAND P ↑ => Qty D↓ P ↓ => Qty D↑ Px • Elasticity of demand (Ed) measures the sensitivity of quantity demanded in response to a change in price: Ed = % ∆ Qty D % ∆ P Qty Examples: Price ↑ 10% causes Qty Demanded ↓15% then Ed= ______ Price ↑ 10% causes Qty Demanded ↓5% then Ed= ______
3 Types of Demand Curves Price Price Inelastic = Steep Elastic = Flat • Elastic Demand = Ed is > 1 • % Qty D changes more than % price change • Inelastic Demand = Ed < 1 • % Qty D changes less than % price change • Unit Elastic Demand = Ed = 1 • % Qty D changes the same as % price change • Price ↓10% => Quantity Demanded ↑10% D1 D1 Qty Qty Ed = % ∆ Qty D % ∆ P
D1 D1 Determinants of Elasticity of Demand • Number of Close Substitutes (what else can you buy) • Necessities vs. Luxuries (do you have to buy it?) • Proportion of Income (is it expensive) • Time Horizon (when do you need it?) Demand is moreelastic when: • Larger # of substitutes • Good is a luxury • Larger proportion income • Longer time period Elastic Inelastic
Gasoline Soda Heart Surgery Table Salt Price Elastic orPrice Inelastic? Price Inelastic Necessity & No real substitutes Price Elastic Many substitutes Price Inelastic Necessity & No real substitutes, Short time period Price Inelastic Small proportion of income, no good substitute
Worksheet #1 • Lesson 4, Activity 18
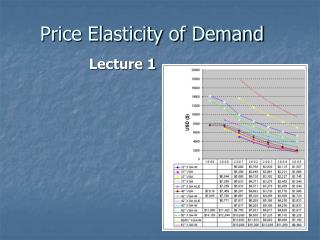
2018?Can the U.S. reach Full Potential GDP? • SP500 Total Return • 2008 -37.0% • 2009 +26.0% • 2010 +15.0% • 2011 +0.0 % • 2012 +13.0% • +29.6% • +13.6% • -0.73% • +12.54% • +14.00% Dec 2007 – Dec 2015 +4.0% per year Dec 2008 - Dec 2015 +12.8% per year => $100,000 turns into $190,000