Download
1 / 48
600 likes | 1.12k Views
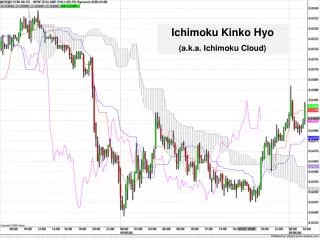
Ichimoku Swing Trading. Robert C. Joiner L. A. Conference 2012. Eastern Indicators:. Ichimoku Heiken-Ashi Renko . The Present:. Tenkan-Sen = 9 moving average Kijun-Sen = 26 moving average. Key points on Tenkan-Sen & Kijun-Sen:. Both lines act as Support & Resistance

E N D
Ichimoku Swing Trading Robert C. Joiner L. A. Conference 2012
Eastern Indicators: Ichimoku Heiken-Ashi Renko
The Present: Tenkan-Sen = 9 moving average Kijun-Sen = 26 moving average
Key points on Tenkan-Sen & Kijun-Sen: Both lines act as Support & Resistance Price crossing the Tenkan-Sen is the first sign of possible reversal Tenkan-Sen crossing up and through Kijun-Sen is more Bullish above the Kumo Tenkan-Sen crossing down and through Kijun-Sen is more Bearish below the Kumo
The Future: Kumo Senkou Span A = (9 + 26 moving averages)/2 Senkou Span B = (hi & lows P52)/2 …then drop those answers 26 periods into the future.
Key Points on Kumo: Kumo acts as both Support and Resistance Thick Kumo is stronger than thin Kumo Price above Kumo is Bullish Price below Kumo is Bearish Rising far right edge of Kumo is Bullish Falling far right edge of Kumo is Bearish
The Past: Chiku = Closing price of current candle …and drop that 26 periods into the past.
Key Points on Chiku: Chiku above the historical price curve is Bullish Chiku below the historical price curve is Bearish Chiku crossing the historical price curve is predictive of a new trend, but should not be anticipated
Between12-29-11 and 2-24-12I posted 39 trades…..38 longs. 1 short.
Western Indicators: Parabolic SAR Money Stream TSV ADX w/DI+ and DI-
Key Points onWestern Indicators: Create intentional chaos. Use different indicators that measure different variables on different moving averages. Parabolic SAR is the weakest indicator, but it makes me think twice about entries and exits. Money Stream + TSV = “Money Indicators”…I want them to be in harmony relative to their moving averages.
Western Indicators, cont. ADX supports the current dominant trend, DI+ or DI-. I like to see ADX rising from below 10 and moving above 20+. The further ADX climbs above 40, the higher the probability of profit taking by investors. I prefer steady upper movement of the dominant DI, creating divergence with the weaker DI, rather than quick spikes.
Entries & Exits: Ideally, you enter a long trade at a moment of weakness within the context of strength. We set 3% and 6% Targets, liquidating 40% of shares on each Target. We move our stop to break-even on the remaining shares after the first target is hit, and use a moveable stop on the remaining shares.
Bought long on 1-6-12 @ $9.78…hit 3% on 1-9-12…hit 6% on 1-10-12…moved stop 8 times…hit stop of $12.53 on 2-7-12…total profit on 20% position was 28% ROI.
How do you find stocks? Scans create candidates; they do not create trades. Scan for Eastern crossovers: Tenkan-Sen crossing Kijun-Sen, Chiku crossing the historical price curve, price moving above Kumo, etc. Scan for Western crossovers: DI+ crossing DI-, rising ADX values, Money indicators crossing their moving averages, etc.