Download
1 / 10
100 likes | 153 Views
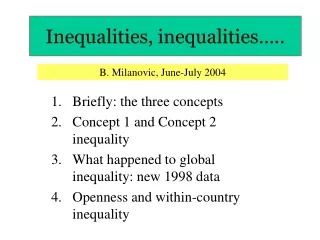
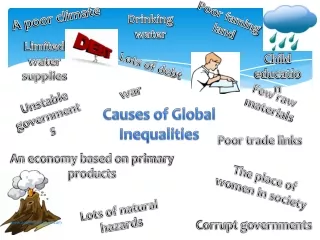
Global Inequalities. 54% of global income goes to just 10% of the world ’ s people, while 40% receive just 5% of global income There are 2.5 billion people in the world today living on less than $3 per day The largest 500 transnational corporations make up over 70% of world trade.

E N D
Global Inequalities 54% of global income goes to just 10% of the world’s people, while 40% receive just 5% of global income There are 2.5 billion people in the world today living on less than $3 per day The largest 500 transnational corporations make up over 70% of world trade. Handley et al (2007) “Geography Focus” Pearson, p202
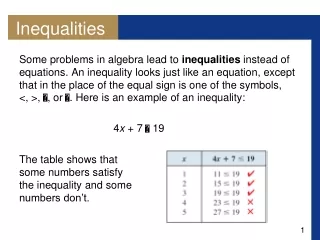
Can you unjumble these mixed up sentences? Write the correct sentences in your workbook. Standard enjoy of where developed living most a of the a country is one people high A developed country is one where most of the people enjoy a high standard of living. One living people of the have developing a country low most of is where a standard A developing country is one where most of the people have a low standard of living. Handley et al (2007) “Geography Focus” Pearson, p205
Kleeman et al (2007) “Global Explorations” p282 • Which photo shows a developed country and which photo shows a developing country? • What things in the photos made you decide?
Alternative measurement to GDP? Can you think of different ways that we could classify a country’s wealth?
The United Nations Millennium Development Goals Parker et al (2004) “Geography for Global Citizens” MacMillan p228
www.un.org/millenniumgoals Visit this site. Draw the 8 symbols the UN have chosen to represent their 8 Development Goals. Go to the reports tab in the menu bar - Click on “The Millennium Development Goals Report 2011.pdf” A picture is shown on the front page of the document. Do you believe this picture was taken in a developing world or a developed world? Give reasons for your response. Each goal is listed in the pdf document. Copy the UN target into your own Word document. READ each section. Beside each goal, write down how far the UN has progressed towards achieving their target. Go to the top right hand side of the home page. Click on Youth. Access the United Nations cyber school bus. What can you do to help? Watch the video of Michael Douglas. How much do we spend on arms each year? And, how much money does the UN need to end poverty?
ACCESS • The United Nations believes access to a range of life essentials will help eradicate poverty. The UN lists these essentials as: • Safe Water • Access to Food • Access to Shelter • Education for All • Health Care • Equal Opportunities for Women • Each group will design a poster and a handout that informs the class how access to their life essential will eradicate poverty by 2015. You will have 2 periods to complete this task.
Ecological FootprintThink back to last term – How many planets did you need to sustain your current lifestyle?The diagram below explains WHY. Bliss & Paine (2005) “GeoActive 1” Jacaranda, p243
Stop the Burn: Renewable Resources are the only way forward. Newspaper Activity Write a 200 word newspaper article using the headline below. The article will be an investigation into why humanity must use alternative fuels. Remember to include an image and a byline for your article.