Download
1 / 65
660 likes | 795 Views
Climate change and the water resources of the western U.S. Dennis P. Lettenmaier Department of Civil and Environmental Engineering University of Washington University of Texas Austin Center for Integrated Earth System Science Seminar Series March 25 , 2013. Outline.

E N D
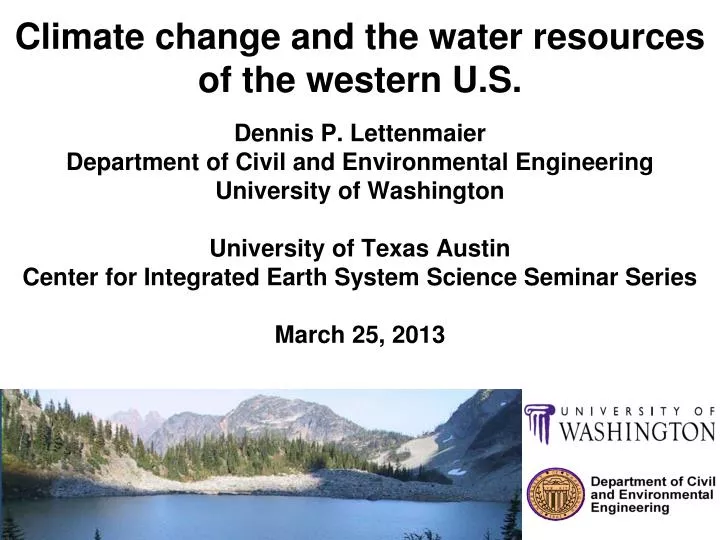
Climate change and the water resources of the western U.S. Dennis P. Lettenmaier Department of Civil and Environmental Engineering University of Washington University of Texas Austin Center for Integrated Earth System Science Seminar Series March 25, 2013
Outline • The hydrology of the western U.S. is changing • Global and regional perspectives on future climate projections • Widely varying projections of future Colorado River streamflows • Understanding hydrologic sensitivities to climate change – the Colorado River basin as a case study • Water management implications • Preview of IPCC AR5 climate simulations with respect to Colorado River streamflows
Positive + Negative Soil Moisture Annual Trends • Positive trends for ~45% of CONUS (1482 grid cells) • Negative trends for ~3% of model domain (99 grid cells)
Trends in annual precipitation maxima in 100 largest U.S. urban areas, 1950-2009 from Mishra and Lettenmaier, GRL 2011
Number of statistically significant increasing and decreasing trends in U.S. streamflow (of 395 stations) by quantile (from Lins and Slack, 1999)
Median runoff sensitivities per degree of global warming (averaged over 68 IPCC AR4 model pairs) from Tang et al., GRL, 2012
Tang et al (2012) results of the USGS water resources regions of the Continental U.S. and Alaska from Tang et al., GRL, 2012
3. Widely varying predictions (projections) of future Colorado River streamflows
Sensitivity of projected change in runoff to spatial resolution from Seager et al, Science, 2007
Lake Level Declines Imagery from http://www.nasa.gov/vision/earth/lookingatearth/Lake_Mead2004.html
Whyis there such a wide range of projections of impacts of future climate change on Colorado River streamflow?
Past Studies Information from Table 5-1 in Western Water Assessment (WWA) report for Colorado Water Conservation Board “ Colorado Climate Change: A Synthesis to Support Water Resource Management and Adaptation.” Oct 2008 (available online at: http://cwcb.state.co.us/NR/rdonlyres/8118BBDB-4E54-4189-A354-3885EEF778A8/0/CCSection5.pdf)
Studies using various approaches: • Seager et al. 2007; Seager et al. 2013 • Milly et al. 2005 • Christensen et al. 2004; Christensen and Lettenmaier, 2007; Cayan et al. 2010; USBR 2011 • Gao et al. 2011; Rasmussen et al. 2011 • Gao et al. 2012 • Hoerling and Eischeid 2007 • Cook et al. 2004 • Woodhouse et al. 2006; McCabe and Wolock 2007; Meko et al. 2007; USBR 2011 • Abbreviations: • GCM – Global Climate Model • RCM – Regional Climate Model • PDSI – Palmer Drought Severity Index • P – Precipitation • T – Temperature • R – Runoff • E – Evaporation • S. downscaling – statistical downscaling GCMs, Emission scenarios, Time periods, Spatial resolution Land surface representation Approaches to generating climate projections. Dotted lines indicate future studies. Figure from Vano et al., BAMS, in review
GCMs: 1 (PCM) Emission scenarios: BAU Total Projections: 3 (multiple runs) Time periods: 2020s, 2050s, 2080s Spatial resolution: 1/8° (~12 km) Land surface: Hydrologic model (VIC) estimate: -18%
GCMs: 12 Emission scenarios: A1B Total Projections: 24 (multiple runs) Time period: 2041-2060 Spatial resolution: 2° (~200 km) Land surface: GCM runoff estimate: -10 to -20% Lower figure replotted from Milly et al. (2005), from Harding et al. (HESS, 2012).
GCMs: 18 Emission scenarios: A1B Total Projections: 42 (multiple runs) Time period: 1900-2050 Spatial resolution: climate divisions (~150 km) Land surface: PDSI Index with regression estimate: -45%
GCMs: 11 Emission scenarios: A2, B1 Total Projections: 22 Time period: 2020s, 2050s, 2080s Spatial resolution: 1/8° (~12 km) Land surface: Hydrologic model (VIC) estimate: -6% (-40 to +18%)
GCMs: 19 Emission scenarios: A1B Total Projections: 49 (multiple runs) Time period: 1900-2098 Spatial resolution: 2° (~200 km) Land surface: GCM (P-E) estimate: -16% (-8 to -25%)
GCMs: estimated 2°C from GCMs and 0.86°C from current trend Emission scenarios: NA Total Projections: 2 Time period: 1490-1998 Spatial resolution: 62 HUC8s Land surface:% adjustment based on simple water balance model and proxy reconstruction Figure 2. Boxplot of mean water-year flow (mcm) for the Upper Colorado River basin for 100-year moving periods during 1490–1998 (determined using tree-ring reconstructed water-year flows). Also indicated are mean water-year UCRB flows for the 20th century (1901–2000, based on water-balance esti- mates), 0.86 degrees Celsius (°C) and 2°C warmings (labeled as T + 0.86°C and T + 2°C respectively) applied to the 20th century water-balance estimates, and 0.86oC and 2°C warmings applied to the driest century (1573–1672) from the tree-ring reconstructed flow time series. estimate: -17%
GCMs: 16 Emission scenarios: A2, A1B, B1 Total projections: 112 (multiple runs) Time period: 1950-2099 Spatial resolution: 1/8° (~12 km) Land surface: Hydrologic model (VIC) estimate: -15 to-20%
Whyis there such a wide range of projections of impacts of future climate change on Colorado River streamflow, andhowshould this uncertainty be interpreted?
Sources of Uncertainty in Future Projections Global Climate Model (GCM) and emission scenario selection Spatial scale and topographic dependence of climate change projections Land surface representations Statistical downscaling methods
1) Global Climate Model (GCM) and emission scenario selection (a) Different GCMs, A1B scenario Figure from Vano et al., BAMS, in review.
1) Global Climate Model (GCM) and emission scenario selection (a) Different GCMs, A1B scenario (b) Same GCMs, Different scenarios Figure from Vano et al., BAMS, in review.
0 100 200 300 400 500 600 700 800 900 1000 Runoff (mm/year) 2) Spatial scale and topographic dependence of climate change projections Figure from Vano et al., BAMS, in review.
3) Land surface representations GFDL GCM Hydrologic Component • Grid-based simulations of land-surface processes using principles of energy and water balance • Daily timesteps with some sub-daily processes • Forcing data: precipitation, temperature, specific humidity, wind speed, air pressure, and surface incident shortwave and longwave • Interested in those applied at regional to global scales • Diverse heritages and many more than those pictured above
3) Land surface representations Q ref+0.1°C - Qref Temperature Sensitivity Q ref+1% - Qref = Qref Precipitation Elasticity = Qref 0.1 °C 1% Land Surface Representations Land Surface Representations Figure from Vano et al., BAMS, in review
4) Statistical downscaling methods How do we translate global info into regional water management? Figure courtesy of Phil Mote
4) Statistical downscaling methods Comparison of BCSD downscaling from Christensen and Lettenmaier (2007) with a delta method downscaling approach for Lees Ferry in the 2040-2069 future period for the A2 where, on average, the BCSD approach has a decline of 7% whereas with the delta method, declines are 13%. Figure from Vano et al., BAMS, in review
4. Understanding hydrologic sensitivities to climate change – the Colorado River basin as a case study
I. Multi-model approach II. Hydrologic sensitivities approach maps of sensitivities to temp & precip change Climate Impact Climate Impact Global Climate Models Global Climate Models downscaling, bias correcting Hydrology Models stream routing, bias correcting Changes in Central Tendencies Water Supply Operations Models
Climate Scenarios Performance Measures Downscaling Global climate simulations, next ~100 yrs Delta Precip, Temp Reliability of System Objectives Water Management Model Hydrologic Model (VIC) DamReleases, Regulated Streamflow Natural Streamflow
Methodology Q ref+0.1 - Qref T sensitivity = Qref Q ref+1% - Qref P elasticity = 0.1°C Qref 1% Land-surface Hydrologic Models Measures Catchment LSM Community Land Model 3.5 (CLM) Noah 2.7 LSM Noah 2.8 LSM Sacramento (Sac) Variable Infiltration Capacity 4.0.6 (VIC) P &T interactions Spatially…
Land-surface Hydrologic Models • Grid-based simulations of land-surface processes using principles of energy and water balance • Selected LSMs that have been widely applied at regional to global scales • Diverse heritages: • Sac and VIC developed specifically for streamflow simulation purposes • Noah, Catchment, CLM developed for use in global climate models • Model versions used as in previous studies, did not calibrate for this study
Land-surface Hydrologic Models • 1/8 degree latitude-longitude spatial resolution • Similar forcing data: precipitation, temperature, specific humidity, wind speed, air pressure, and surface incident shortwave and longwave • Daily timesteps with some sub-daily processes • Results reported for water years 1975-2005
Historical 1 ºC 2 ºC 3 ºC Delta method climate forcings • Applied uniform perturbations in precipitation or temperature at every timestep in historic record • Precipitation change: related magnitude change in streamflow • Temp increases: streamflow decreases annually, primarily because decreases flow in spring/summer • Common across models? Where are these changes occurring? Specific land-surface characteristics? Thresholds? VIC
1 ºC 2 ºC 3 ºC Delta method climate forcings Discharge, cms VIC Sac CLM Catchment Historical Discharge, cms At Lees Ferry, flows differ between models, but models appear to have similar patterns in temp sensitivity Noah 2.7 Noah 2.8
1 ºC 2 ºC 3 ºC Delta method climate forcings Discharge, cms VIC Sac CLM Catchment Historical Discharge, cms At Lees Ferry, flows differ between models, but models appear to have similar patterns in temp sensitivity Noah 2.7 Noah 2.8
Precipitation Elasticities percent change in flow per percent increase in precipitation Q ref+1% - Qref P elasticity = Qref 1% historic flows at Lees Ferry precipelast, Lees Ferry reference precipitation (100% = historical) observed (non-parametric estimator)
Precipitation Elasticities percent change in flow per percent increase in precipitation Q ref+1% - Qref P elasticity = Qref 1% historic flows at Lees Ferry precipelast, Lees Ferry reference precipitation (100% = historical) observed (non-parametric estimator)
Precipitation Elasticities percent change in flow per percent increase in precipitation Q ref+1% - Qref P elasticity = Qref 1% historic flows at Lees Ferry precipelast, Lees Ferry reference precipitation (100% = historical) observed (non-parametric estimator)
Precipitation Elasticities percent change in flow per percent increase in precipitation Q ref+1% - Qref P elasticity = Qref 1% historic flows at Lees Ferry precipelast, Lees Ferry 0 200 400 600 800 1000 1200 1400 average runoff (cms)
Temperature Sensitivity Q ref+0.1 - Qref T Sensitivity (Tmin&Tmax) = Qref 0.1 ° C percent change in flow per °C temperature increase temp sens (%), Lees Ferry (Tmin & Tmax) reference temp in °C (historical = 0)
Precipitation & Temperature ? Q1%prcp Q1°C & 1%prcp Q base + (Q1%prcp- Qbase) +(Q1°C - Qbase) =Q1°C & 1%prcp Q base Q1°C ? estimated actual sim rearrange to more easily compare small differences: ? (Q1%prcp- Qbase) + (Q1°C - Qbase) = Q1°C & 1%prcp – Qbase
Projected changes in 21st C Colorado River Streamflow, full simulation vs sensitivity-based reconstruction
Categories of Sub-basin Responses to changes in annual flow (VIC) Watershed units More sensitive to cool season warming More sensitive to warm season warming Cool season warming positive Example watersheds (below) LEGEND ★ ★ ★ ★ Responsesin: Example watersheds: Warm applied year-round Warming applied in warm season only Warming applied in cool season only Streamflow change (%)