Download
1 / 1
10 likes | 90 Views
H.D. Aller and M.F. Aller (U. of Michigan). Introduction. Theoretical Simulation of Emitting Region.

E N D
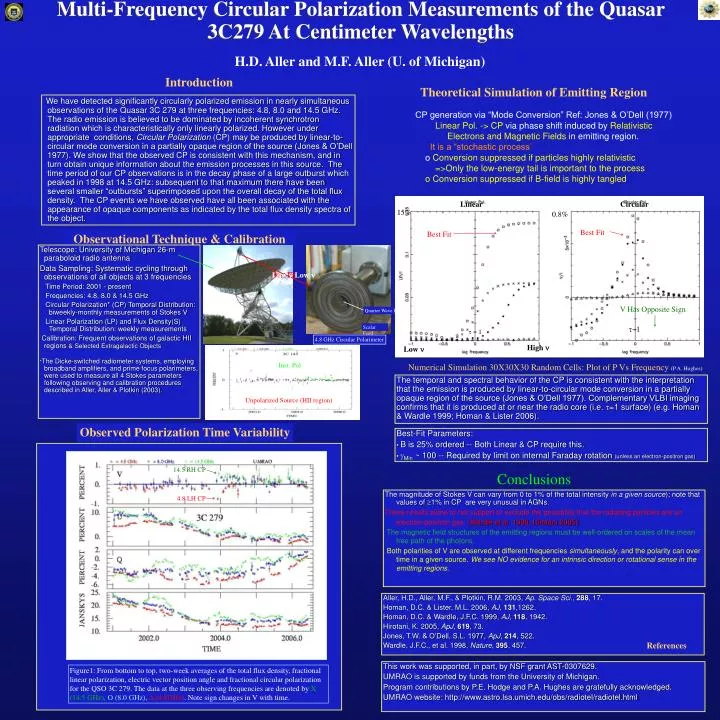
H.D. Aller and M.F. Aller (U. of Michigan) Introduction Theoretical Simulation of Emitting Region We have detected significantly circularly polarized emission in nearly simultaneous observations of the Quasar 3C 279 at three frequencies: 4.8, 8.0 and 14.5 GHz. The radio emission is believed to be dominated by incoherent synchrotron radiation which is characteristically only linearly polarized. However under appropriate conditions, Circular Polarization (CP) may be produced by linear-to-circular mode conversion in a partially opaque region of the source (Jones & O’Dell 1977). We show that the observed CP is consistent with this mechanism, and in turn obtain unique information about the emission processes in this source. The time period of our CP observations is in the decay phase of a large outburst which peaked in 1998 at 14.5 GHz: subsequent to that maximum there have been several smaller “outbursts” superimposed upon the overall decay of the total flux density. The CP events we have observed have all been associated with the appearance of opaque components as indicated by the total flux density spectra of the object. • CP generation via “Mode Conversion” Ref: Jones & O’Dell (1977) • Linear Pol. -> CP via phase shift induced by Relativistic • Electrons and Magnetic Fields in emitting region. • It is a “stochastic process” • Conversion suppressed if particles highly relativistic • =>Only the low-energy tail is important to the process • Conversion suppressed if B-field is highly tangled Linear Circular 15% Multi-Frequency Circular Polarization Measurements of the Quasar 3C279 At Centimeter Wavelengths 0.8% Best Fit Best Fit Observational Technique & Calibration • Telescope: University of Michigan 26-m paraboloid radio antenna • Data Sampling: Systematic cycling through observations of all objects at 3 frequencies • Time Period: 2001 - present • Frequencies: 4.8, 8.0 & 14.5 GHz • Circular Polarization* (CP) Temporal Distribution: biweekly-monthly measurements of Stokes V • Linear Polarization (LP) and Flux Density(S) Temporal Distribution: weekly measurements • Calibration: Frequent observations of galactic HII regions & Selected Extragalactic Objects • *The Dicke-switched radiometer systems, employing broadband amplifiers, and prime focus polarimeters, were used to measure all 4 Stokes parameters following observing and calibration procedures described in Aller, Aller & Plotkin (2003). Best Fit Best Fit Low Low V Has Opposite Sign Quarter Wave Plate Scalar Feed ~1 ~ 1 4.8 GHz Circular Polarimeter High Low Inst. Pol Numerical Simulation 30X30X30 Random Cells: Plot of P Vs Frequency (P.A. Hughes) The temporal and spectral behavior of the CP is consistent with the interpretation that the emission is produced by linear-to-circular mode conversion in a partially opaque region of the source (Jones & O’Dell 1977). Complementary VLBI imaging confirms that it is produced at or near the radio core (i.e. =1 surface) (e.g. Homan & Wardle 1999; Homan & Lister 2006). Unpolarized Source (HII region) Observed Polarization Time Variability Best-Fit Parameters: • B is 25% ordered -- Both Linear & CP require this. • Min ~ 100 -- Required by limit on internal Faraday rotation (unless an electron-positron gas) 14.5 RH CP Conclusions The magnitude of Stokes V can vary from 0 to 1% of the total intensity in a given source); note that values of 1% in CP are very unusual in AGNs. These results alone to not support or exclude the possibility that the radiating particles are an electron-positron gas. (Wardle et al. 1998, Hirotani 2005). The magnetic field structures of the emitting regionsmust be well-ordered on scales of the mean free path of the photons. Both polarities of V are observed at different frequencies simultaneously, and the polarity can over time in a given source. We see NO evidence for an intrinsic direction or rotational sense in the emitting regions. 4.8 LH CP Aller, H.D., Aller, M.F., & Plotkin, R.M. 2003, Ap. Space Sci., 288, 17. Homan, D.C. & Lister, M.L. 2006, AJ, 131,1262. Homan, D.C. & Wardle, J.F.C. 1999, AJ, 118, 1942. Hirotani, K. 2005, ApJ, 619, 73. Jones, T.W. & O’Dell, S.L. 1977, ApJ, 214, 522. Wardle, J.F.C., et al. 1998, Nature, 395, 457. References This work was supported, in part, by NSF grant AST-0307629. UMRAO is supported by funds from the University of Michigan. Program contributions by P.E. Hodge and P.A. Hughes are gratefully acknowledged. UMRAO website: http://www.astro.lsa.umich.edu/obs/radiotel/radiotel.html Figure1: From bottom to top, two-week averages of the total flux density, fractional linear polarization, electric vector position angle and fractional circular polarization for the QSO 3C 279. The data at the three observing frequencies are denoted by X (14.5 GHz),O (8.0 GHz),∆ (4.8GHz). Note sign changes in V with time.