Download
1 / 1
10 likes | 129 Views
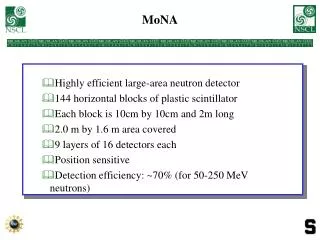
MoNA electronics. t left = d left / v light. t right = d right / v light. CFD. TDC. TDC. CFD. center of gravity vs. x(m). 0.4. 0.3. 0.2. 0.1. Center of gravity. 0. 0. 0.5. 1. 1.5. 2. -0.1. -0.2. y = -0.3717x + 0.3068. -0.3. R. 2. = 0.9371. -0.4. -0.5. X(m).

E N D
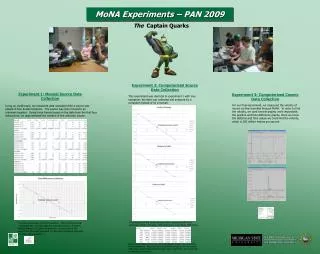
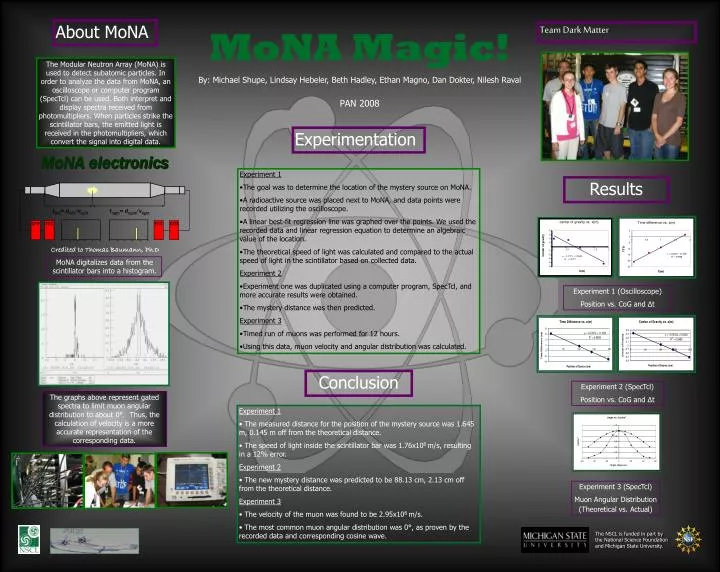
MoNA electronics tleft= dleft/vlight tright= dright/vlight CFD TDC TDC CFD center of gravity vs. x(m) 0.4 0.3 0.2 0.1 Center of gravity 0 0 0.5 1 1.5 2 -0.1 -0.2 y = -0.3717x + 0.3068 -0.3 R 2 = 0.9371 -0.4 -0.5 X(m) About MoNA MoNA Magic! Team Dark Matter The Modular Neutron Array (MoNA) is used to detect subatomic particles. In order to analyze the data from MoNA, an oscilloscope or computer program (SpecTcl) can be used. Both interpret and display spectra received from photomultipliers. When particles strike the scintillator bars, the emitted light is received in the photomultipliers, which convert the signal into digital data. By: Michael Shupe, Lindsay Hebeler, Beth Hadley, Ethan Magno, Dan Dokter, Nilesh Raval PAN 2008 Experimentation • Experiment 1 • The goal was to determine the location of the mystery source on MoNA. • A radioactive source was placed next to MoNA, and data points were recorded utilizing the oscilloscope. • A linear best-fit regression line was graphed over the points. We used the recorded data and linear regression equation to determine an algebraic value of the location. • The theoretical speed of light was calculated and compared to the actual speed of light in the scintillator based on collected data. • Experiment 2 • Experiment one was duplicated using a computer program, SpecTcl, and more accurate results were obtained. • The mystery distance was then predicted. • Experiment 3 • Timed run of muons was performed for 12 hours. • Using this data, muon velocity and angular distribution was calculated. Results Credited to Thomas Baumann, Ph.D MoNA digitalizes data from the scintillator bars into a histogram. Experiment 1 (Oscilloscope) Position vs. CoG and Δt Conclusion Experiment 2 (SpecTcl) Position vs. CoG and Δt The graphs above represent gated spectra to limit muon angular distribution to about 0°. Thus, the calculation of velocity is a more accurate representation of the corresponding data. • Experiment 1 • The measured distance for the position of the mystery source was 1.645 m, 0.145 m off from the theoretical distance. • The speed of light inside the scintillator bar was 1.76x10⁸ m/s, resulting in a 12% error. • Experiment 2 • The new mystery distance was predicted to be 88.13 cm, 2.13 cm off from the theoretical distance. • Experiment 3 • The velocity of the muon was found to be 2.95x10⁸ m/s. • The most common muon angular distribution was 0°, as proven by the recorded data and corresponding cosine wave. Experiment 3 (SpecTcl) Muon Angular Distribution (Theoretical vs. Actual)