Download
1 / 19
190 likes | 195 Views
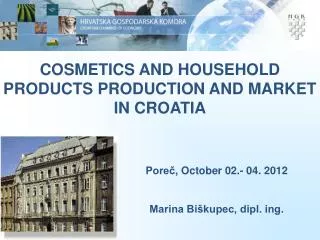
PRODUCTION AND PROCESSING OF HYDROCARBONS IN CROATIA ( 2000 - 2013 ). Dr. Josipa Velić , Full Prof. Dr. Tomislav Malvić ,Assoc. Prof. 1. General facts. The Croatian hydrocarbon fields are located in two hydrocarbon geological regional systems:

E N D
PRODUCTION AND PROCESSING OF HYDROCARBONS IN CROATIA (2000-2013) Dr. Josipa Velić, Full Prof. Dr. Tomislav Malvić,Assoc. Prof.
1. General facts • The Croatian hydrocarbon fields are located in two hydrocarbon geological regional systems: • Croatian part of the Pannonian Basin System (CPBS; Fig. 1), • Croatian Northern Adriatic part of the Po Depression (CNAP; Fig. 2). Fig. 1: Oil and gas fields in Croatian part of Pannonian Basin System (Velić, 2007)
2. Oil and condensate The ratio between produced vs. proven volumes (OIL and CONDENSATE) is given on Fig. 3 as annual report (2000-2014). It is clear that proven reserves had been slighlty Increased, when production declined. Fig. 3: Proven vs. produced volumes of oil and condensate (2000-2014)
Oil vs. condensate proven reserves are given on Fig. 4. • It is clear trend of oil domination but • also increasing oil/condensate ration from almost 2/1 to more than 6/1. • Reasons: • Faster depletion of condensate; • Report system. Fig. 4: Proven reserves of oil and condensate (2000-2014)
However (Fig. 5) does not follow such trend. Oil/condensate production ratio remained almost same about 3/1 through entire period. Reason: (a) Reserve report system. Fig. 5: Produced volumes of oil and codensate (2000-2014)
3. Natural gas • The ratio gas reserves/production (Fig. 6) is constantly declined to about 10/1. • Reasons: • There is no new reservoirs; • Reserve report system. Fig. 6: Proven reserves and produced volumes of natural gas (2000-2014)
It is visible (Fig. 7) major changes in gas production ratio: • (a) In 2000 as domination • of CPBS; • (b) In 2010 slight domination of CNAP; • (c) In 2013 about 50:50 between CPBS and CNAP. • Reasons: • Size of reservoirs; • Lithologies and production rates. Fig. 7: Ratio of natural gas recovered in CPBS and CNAP from 2000 to 2013 (Kišić, 2015)
4. Domestic vs. imported hydrocarbons volumes in Croatia • Fig. 8 trend: • Production declines regarding total reserves (about 50%); • (b) Import remaines almost constant (about 80% needs). • Reasons: • Keeping long-term recoverable reserves; • Reserve system reporting; • Low total recoverable volumes. No available data about import No available data about import Fig. 8: Produced vs. proven reserves of oil and condensate(B/A) and imported volumes vs. total consumption of crude oil (C/D) from 2000 to 2014
Regarding gas (Fig. 9): • Production vs. reserves grow; • Import has beenincreased up to 45%. • Reason: • Need for gas increased (replacement of energy sources); No available data about import No available data about import Fig. 9: Produced vs. proven reserves of gas (B/A) and imported volumes vs. total consumption of gas (C/D) from 2000 to 2014
4. Import vs. consumption in Croatia • Ratio import vs. consumption remains almost the same (Fig. 10) • although volumes varied. • Reason: • Contry energy policy remains in the last 2 decades almost the same; • There is no decision among: (a) new HC reserves, (b) renevable domination, (c) coal, (d) import domination. No available data Fig. 10: Total consumption and imported volumes of crude oil (2000-2014)
During 2000-2013 productin fullfilled only about 20% of needs (Fig. 11). Fig. 11: Ratio of domestic production and imported volumes of oil in Croatia from 2000 to 2013 (Kišić, 2015)
Opposite to oil, gas import is lesser than producing (Fig. 12). No available data Fig. 12: Total consumption and imported volumes of natural gas (2000 to 2014)
The same trend of such domination (domestic gas vs. Imported) is clearly seen at Fig. 13. Fig. 13: Ratio of domestic production and imported volumes of natural gas 2000-2013 (Kišić, 2015)
5. Processing (refinery) products in Croatia • In processing there is large omination (about 80%) of (Fig. 14): • gasoline, • diesel and • fuel oil. Fig. 14: Petroleum refinery products in Croatia from 2000 to 2013 in % (Kišić, 2015)
The most of petroleum products are used in transport (Fig. 15). Fig. 15: The consumption of oil products per sectors in Croatia from 2000 to 2013 (Kišić, 2015)
The most of gas is consumed in energy transformation (Fig. 16). Fig. 16: The consumption of natural gas per sectors 2000-2013 (Kišić, 2015)
6. Conclusions 1. The Republic of Croatia has a long history in hydrocarbon exploration, recovering and processing. 2. Currently around 60% of the needs for gas and 20% of the needs foroil are covered by local production. 3. Production in Croatia declines, and in regards to expectationsof increasingdemand in the future, it will become necessary toimport larger quantitiesor discover new reservoirs. 4. In the Croatian consumption balance sheet of primary energy, oil andpetroleum products make up the largest share. That should certainlynot changesignificantly in the following few decades. 5. Only changes in the structure of petroleum products consumption areexpected, with natural gas consumption shares on the rise. 6. In regards to this state of affairs, Croatia should decrease its energy dependenceon imported energy. It is necessary to construct anefficient energy infrastructure, which would guarantee the safety of supply, for which surely there arenumerous solutions.
7. Mention earlier, producing of hydrocarbons will continue to decline due to reservoirs depletion, but discovering of new reservoirs could slow that process. 8. The Croatian part of the Pannonian Basin System is awell-expored territory, however so-called residual hydrocarbons, by-passed oil andsatellite reservoirs are supposed to exist, what is endorsed by numerous conducted researches. 9. In the Northern Adriatic offshore additional reserves of natural gas can also be expected, especially in parts that were not explored thoroughly. 10. In order for our refineries to operate successfully, they must meetthe demands of a constantly changing market and asking for higher quality. They are in the process of technological restructuring, which should accomplish an increase in product quality and marketprice reflecting changes in the structure of petroleumproduct consumption. It is also important to ensure diversity of import routes and storagecapabilities of oil and natural gas, to ensure safety of delivery in conditions of uncertainty. 11. Croatia can withstand the challenges of energy dependency by improving the efficiency of energy use, as well as using alternativeforms of energy such as renewable sources, which should increase in importance in total consumption.