Download
1 / 30
320 likes | 515 Views
Relief is so perfectly and accurately represented on topographic maps that if you look on them at a distance of 1 meter you will see crests and valleys, as on a thermoformed map. In the following, you will learn the different techniques used to represent relief on topographic maps. Contour lines

E N D
Relief is so perfectly and accurately represented on topographic maps that if you look on them at a distance of 1 meter you will see crests and valleys, as on a thermoformed map. In the following, you will learn the different techniques used to represent relief on topographic maps.
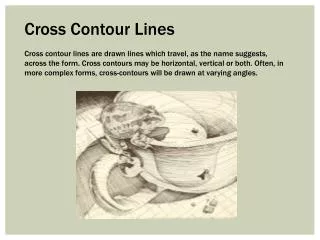
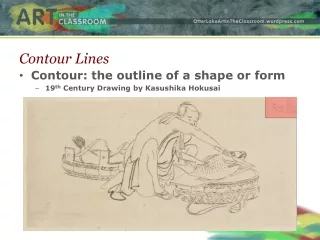
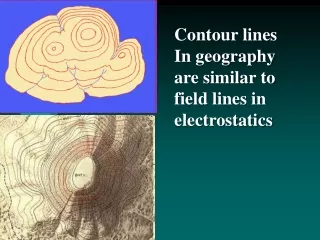
Contour lines Contour lines are an effective device for representing relief on topographic maps. They can be defined as an imaginary line connecting points of equal elevation on the ground surface. As with all types of isolines, when contour lines are close together, they represent a steep slope, whereas when lines are far from each other, they represent a gradual slope. Every fifth or tenth contour starting at sea level is an index contour, which is drawn as a heavier line and is labelled. Each topographic map uses a contour interval, or equidistance, (the distance in elevation between contour lines) appropriate for that area. While flat areas may be mapped with a 5 meter contour interval, stepped terrain may have a 20 meter or more contour interval. This is why the contour interval is still specified on the topographic map legend.
Drawing contour lines is a way to represent a terrain surface with a sample of elevations. Instead of measuring and depicting elevation at every point, you measure only along lines at which a series of imaginary horizontal planes slice through the terrain surface. The more imaginary planes, the more contours, and the more detail is captured.
Advantages:It depict slope and size of different landforms on map. By reading contour interval it is easy to determine the different elevation of the landscape. It provide the basis for coloring method. It can be used in drawing cross section of the given features on the mapped area Disadvantages:Contour fail to show some of the heights due to limitation of vertical interval. Some of the landforms cannot be shown by using contours for example coral reef, outcrop rock and craters Contour method is mostly not used to show relief on small scale map as it may obscure some details
Hachures are an older mode of representing relief. They show orientation of slope, and by their thickness and overall density they provide a general sense of steepness. Being non-numeric, they are less useful to a scientific survey than contours, but can successfully communicate quite specific shapes of terrain. They are a form of shading, although different from the one used in shaded maps. Hachure representation of relief was standardized by the Austrian topographer Johann Georg Lehmann in 1799.Hachures may be combined with other ways of representing relief, like shades, the result being a shaded hachure map;
The hachures are drawn in the direction of the steepest gradient. The hachures are arranged in rows perpendicular to their direction. The length and thickness of each stroke represents the drop in height along its direction: a short and thick stroke represents a short and steep slope, while a long and thin stroke represents a long and gentle slope. The strokes are spaced at an equal distance inside a row. The strokes have the same thickness inside a row. If the map is illuminated, strokes are thinner and farther apart on the illuminated side.
Hill Shading It is imagined that if the light is throw on a region from north or north-west side, how its shadow will fall and according to that, slope of relief is shown by light to dark shades. The area of steep slope of opposite side of light i.e. eastern and south eastern is shown by dark shade and the area of gentle slope is shown by light shade. This method is also known as ‘plastic shading’
Different methods to map terrain elevation: • Contours • Layer tints • Shaded relief • 3D view How to map the terrain elevation Cartographic technique where lines connect points of equal elevation at a selected interval.
Different methods to map terrain elevation: • Contours • Layer tints • Shaded relief • 3D view A cartographic technique of showing relief on maps by coloring in different shades those parts which lie between selected levels.
Different methods to map terrain elevation: • Contours • Layer tints • Shaded relief • 3D view Cartographic technique where lines connect points of equal elevation at a selected interval.
Different methods to map terrain elevation: • Contours • Layer tints • Shaded relief • 3D view Cartographic technique where lines connect points of equal elevation at a selected interval.
Quantitative Method 1. Spot height: In this method the spots are used to indicate the location of the spot on the map and the height of the place from mean sea level is also written near to it. E.g. • 250. here the (∙) indicates the location and the figure 250 stands for the height. The height will be in meter if the map has metric system and if it has British system the height will be in feet.
In this method location of the place is indicated by small triangle followed by the numbers giving the height above sea level, e,g, (Δ) 200m. These are the points which are used as a station for triangulation survey. Therefore this method is called as Triangulation method or ‘Trig Point’ e.g. mountain, old temple, church etc. Triangulation Method
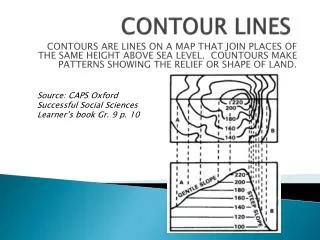
Contour An imaginary line on the ground surface joining the points of equal elevation is known as contour. In other words, contour is a line in which the ground surface is intersected by a level surface obtained by joining points of equal elevation. This line on the map represents a contour and is called contour line.
CHARACTERISTICS OF CONTOURS • Contour lines must close, not necessarily in the limits of the plan. • The horizontal distance between any two contour lines indicates the amount of slope and varies inversely on the amount of slope. • Widely spaced contour indicates flat surface. • Closely spaced contour indicates steep slope ground. • Equally spaced contour indicates uniform slope.
Types of Slopes 1. Gentle Slope A slope with contour lines spread far apart from each other. This even spacing is maintained in both up and down slope
2. Steep Slope A slope represented with contour lines close to each other on a topographical map. Contour lines showing a uniform, steep slope on a map will be evenly spaced, but close together. Remember, the closer the contour lines, the steeper the slope Considering relief only, a uniform, steep slope allows the defender to use grazing fire, and the attacking force has to negotiate a steep incline.
3. Convex Slope A slope which becomes progressively steeper downhill. It can refer to an entire slope or part of one. On a map the contour lines will be spaced closer together with a decline in height above sea-level.
4. Concave Slope A slope which becomes progressively steeper uphill. It can refer to an entire slope or part of one. On a map the Contour lines will be spaced closer with an increase in height above sea-level.
5. Terraced slope The slope looking like terrace is called terraced shape. The elevated part of the step which is having steep slope is drawn by closely spaced contours and the part of the terrace which is having gentle slope is shown by widely spaced contours. There the contours appears as if they are drawn in group of two or three keeping sufficient distances in between.
B. Types of Landforms • Conical Hill :- It rises almost uniformly from the surrounding land. A conical hill with uniform slope and narrow top is represented by concentric contours spaced almost at regular intervals. • A plateau:-A widely stretched flat–topped high land, with relatively steeper slopes, rising above the adjoining plain or sea is called a plateau. The contour lines representing a plateau are normally close spaced at the margins with the innermost contour showing wide gap between its two sides.
3. Spur:- A tongue of land, projecting from higher ground into the lower is called a spur. It is also represented by ‘V’-shaped contours but in the reverse manner. The arms of the V point to the higher ground and the apex of ‘V’ to the lower ones. 4.Gorges:- In high altitudes, gorges form in the areas where the vertical erosion by river is more prominent than the lateral erosion. They are deep and narrow river valleys with very steep sides. A gorge is represented by very closely-spaced contour lines on a map with the innermost contour showing small gap between its two sides.
5. ‘V’-shaped Valley:- It resembles the letter V. A V-shaped valley occurs in mountainous areas. The lowermost part of the V–shaped valley is shown by the innermost contour line with very small gap between its two sides and the lowest value of the contour is assigned to it. The contour value increases with uniform intervals for all other contour lines outward. 6. ‘U’ – shaped Valley A U–shaped valley is formed by strong lateral erosion of glaciers at high altitudes. The flat wide bottom and steep sides makes it resemble the letter ‘U’. The lowermost part of the U–shaped valley is shown by the innermost contour line with a wide gap between its two sides. The contour value increases with uniform intervals for all other contour lines outward.
7. CLIFF:- It is a very steep or almost perpendicular face of landform. On a map, a cliff may be identified by the way the contours run very close to one another, ultimately merging into one. 8. Pass-A pass is a gap, or break, in high, rugged terrain such as a mountain ridge. A pass forms when a glacier or stream erodes, or wears away, the land between areas of higher terrain. Passes often provide the easiest routes for people to travel across steep mountain ranges. For this reason, they have played an important role throughout human history in migration, trade, and settlement.
9. Ridge:- Enlarge image. A ridge is a line of high ground, with the land dropping away on either side. Ridges are common between two hilltops. The low point on a ridge is called a 'col' or 'saddle'.