Download
1 / 37
370 likes | 375 Views
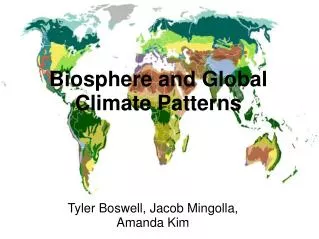
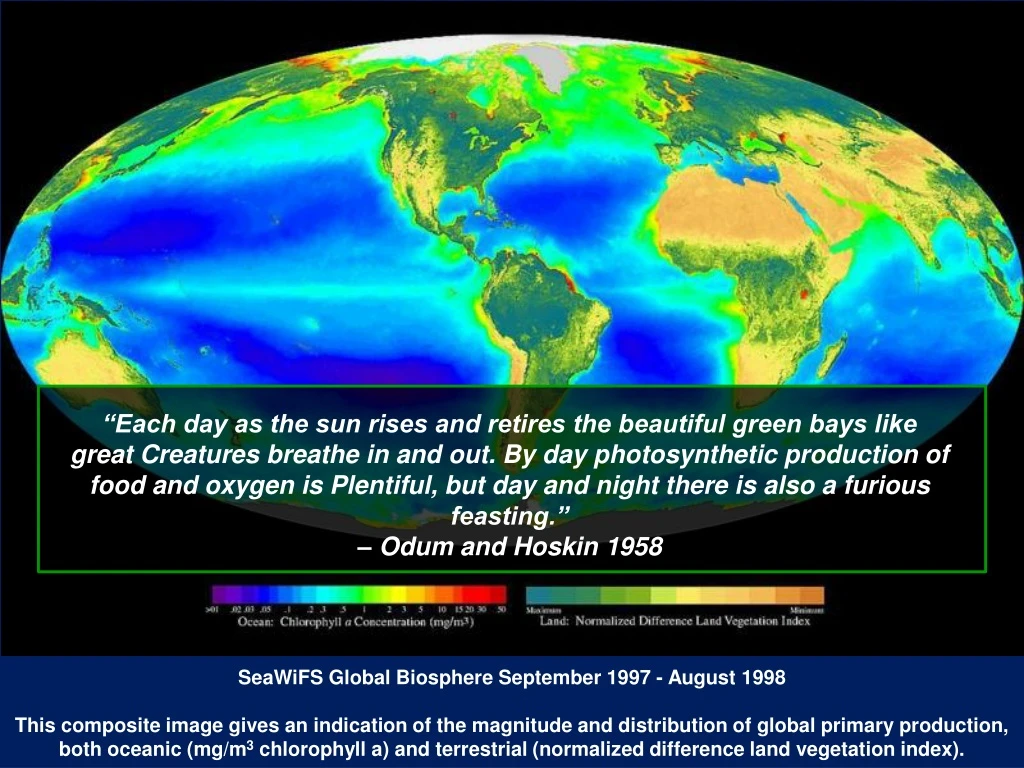
This image illustrates the distribution of global primary production in both oceanic and terrestrial ecosystems, highlighting the importance of photosynthesis in producing organic matter and oxygen. The factors limiting primary production in the ocean, such as nutrients and light availability, are also discussed.

E N D
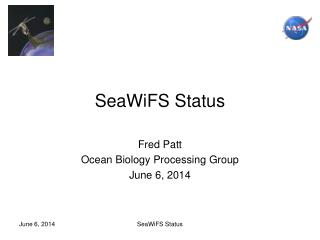
“Each day as the sun rises and retires the beautiful green bays like great Creatures breathe in and out. By day photosynthetic production of food and oxygen is Plentiful, but day and night there is also a furious feasting.” – Odum and Hoskin 1958 SeaWiFS Global Biosphere September 1997 - August 1998 This composite image gives an indication of the magnitude and distribution of global primary production, both oceanic (mg/m3 chlorophyll a) and terrestrial (normalized difference land vegetation index).
Primary production • Primary Production: Organic matter synthesized from inorganic substances. • Photosynthesis: producing organic matter from carbon dioxide and water using Light energy. • Carbon dioxide +Water+LightOrganic matter + Oxygen • 6CO2 + 6H2O + Light C6H12O6 + 6O2 • Photosynthesis consumes CO2 and produces O2
Key Terms: Biomass – static measure of how much, e.g. – how many grams? Primary Production – dynamic measure of how much is (made) produced per unit time, e.g. – how many grams per day?
Controls on primary productivity • Photosynthetic light. • Dissolved inorganic nutrients. • Grazing by zooplankton.
What limits primary production in the ocean? Most common limiting factors: Nutrients Light
Thephoticzone is the depth where light is sufficient for photosynthesis. Thedysphoticzone is where illumination is too weak for photosynthesis. The aphotic zone receives no light from the surface because it is all absorbed by the water above.
Euphotic Zone Infrared Ultraviolet PAR: photosynthetic active radiation (400-700 nanometers)
Major nutrients? • Carbon: important but abundant in seawater. • Nitrate (NO3-), Nitrite (NO2-), Ammonium (NH4+) • Phosphate (PO43-) • Silicate (SiO4) • 106CO2 + 16NO3- + PO43- + 122H2O + 19H+ + Light (CH2O)106(NH3)16(H3PO4) + 138O2 • Redfield ratio C:N:P = 106:16:1(in phytoplankton) Diatoms? C:N:P:Si 106:16:1:16
Justus von Liebig “Father of Fertilizer Industry” (May 12, 1803 - April 18, 1873) 1855: Liebig’s Law of the Minimum: By the deficiency or absence of one necessary constituent, all others being present, the soil is rendered barren for all crops to the life of which that one constituent is indispensable. With equal supplies of the atmospheric conditions for the growth of plants, the yields are directly proportional to the mineral nutrients supplied in the manure. In a soil rich in mineral nutrients, the yield of a field cannot be increased by adding more of the same substances"
Leibig’s Law of the Minimum (for oceans): Phytoplankton growth is determined by the response of phytoplankton to the single factor that is most limiting. These factors include N, P, Fe, Si, and other trace materials.
What are sources of nutrients to ocean? • Source of nutrients: Continents. • weathering, farm fertilizers runoff • wastewater treatment plants….
phytoplankton Primary production by phytoplankton CO2 CO2 Nutrients + Surface Ocean
What are the products of respiration? • Oxygen • Carbon dioxide and nutrients • Organic matter • I don’t know
Respiration • Organic Matter +O2 CO2 + NO3 + PO4 + H2O Respiration (remineralization, regeneration, degradation) • consumes oxygen. • produces carbon dioxide. • regenerates nutrients.
Marine Snow Planktonic tests Fecal pellets www.whoi.edu/oceanus Sinking particles collected in a sediment trap
Let’s draw……. What would a profile of O2 w/ depth look like? How about dissolved inorganic nitrogen? [O2] Epi-pelagic zone ~1000 Depth, m
Depleted by photosynthesis Remineralization 75% of ocean Nutrient remain high, O2 high – because it’s replenished with High oxygen cold water from polar regions….
Vertical distribution of nutrients Depleted in surface water, abundant in deep water PO4 NO3 Si
When do you get a phytoplankton bloom??? Why do we care?
Sverdrup's Model of Critical Depth • Photosynthesis decreases exponentially with depth due to decrease in light availability • Respiration is unaffected by light and remains • constant with depth
Sverdrup's Model of Critical Depth Too much light including harmful UV prohibits photosynthesis Euphotic zone Photosynthesis rate ~100m Depth Respiration rate
Sverdrup's Model of Critical Depth Euphotic zone Photosynthesis rate Compensation Point: Rate of Photosynthesis =Rate of Respiration ~100m Depth Operationally defined as The depth at which 1% Of surface light occurs. Respiration rate
Sverdrup's Model of Critical Depth • Phytoplankton is mixed by turbulence and experiences different light intensities over time, sometimes above and sometimes below compensation point • Critical depth = depth at which photo-synthesis • of the TOTAL water column phytoplankton • population equals their TOTAL respiration
Sverdrup's Model of Critical Depth Euphotic zone Photosynthesis rate ~100m Critical Depth: TOTAL Photosynthesis = TOTAL Respiration Depth Respiration rate A phytoplankton bloom –can only occur if mixing is shallower than this depth…..shallower than the critical depth. Only then is the population net production >0
Low latitude: strong thermocline stratified. • High latitude: vertically well mixed. Temperature High latitude Low latitude Mixing Depth
Primary productivity • Polar oceans: • Nutrients are abundant due to vertical mixing. • limited by sunlight: darkness for winter months. • (partly) covered by sea ice.
Photosynthesis & Respiration Respiration Light bottle Dark bottle Measurements of photosynthesis • Monitoring O2 change in a dark bottle and a light bottle. • (dissolved oxygen is easy to measure) • Light bottle: Photosynthesis – Respiration. • Dark bottle: Respiration only. • Gross photosynthesis: Light bottle – Dark bottle.
Measurements of photosynthesis • Monitoring 14C uptake • Add dissolved 14C spike. • After time duration, filter particles (organic matter produced). • Measure 14C incorporated into particles. • FYI • Radioactivity of 14C is easy to measure when the concentration is VERY high (14C spike). • Measurement of natural level is harder (one 14C out of a trillion 12C in nature).
Measurements • Chlorophyll (Biomassmeasurement): • Pigments that absorb sun light (blue and red ends of the visible spectrum). • Can be monitored by fluorescence (in-situ instrument) and ocean color (satellites) www.succulent-plant.com
Stn A, 2000m Stn B, 3000m Stn C, 3500m Chlorophyll Depth (m) Subsurface Chl. max.
Chlorophyll • Productive along the continents. • Productive in the upwelling regions. • Deserts in centers of gyres (due to downwelling).