Download
1 / 25
250 likes | 276 Views
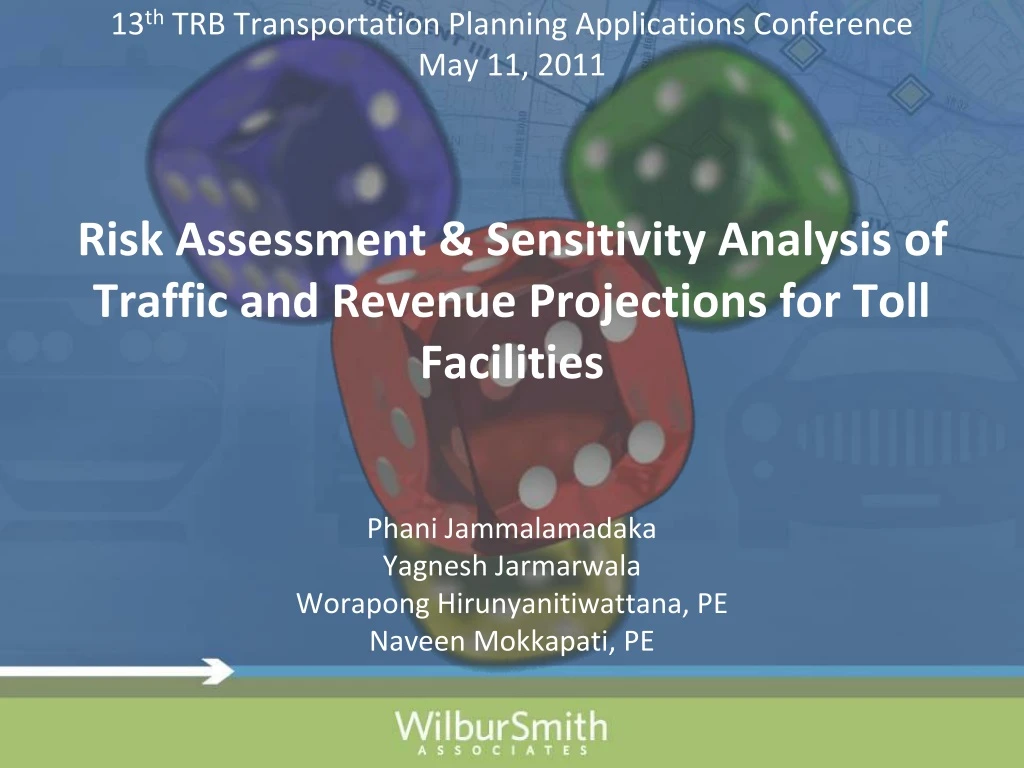
13 th TRB Transportation Planning Applications Conference May 11, 2011 Risk Assessment & Sensitivity Analysis of Traffic and Revenue Projections for Toll Facilities. Phani Jammalamadaka Yagnesh Jarmarwala Worapong Hirunyanitiwattana, PE Naveen Mokkapati, PE. Outline. Background

E N D
13th TRB Transportation Planning Applications ConferenceMay 11, 2011Risk Assessment & Sensitivity Analysis of Traffic and Revenue Projections for Toll Facilities Phani Jammalamadaka Yagnesh Jarmarwala Worapong Hirunyanitiwattana, PE Naveen Mokkapati, PE
Outline Background Traffic/Transactions and Revenue (T&R) process Sensitivity analysis Risk analysis Discussion on uncertainty in T&R Case study Summary/next steps 2
Background Traffic and revenue (T&R) forecasts - typically point estimates Bond investors, rating agencies, etc. prefer rigorous sensitivity/risk assessments in toll road T&R forecasts Risk analysis helps to Quantify uncertainties in inputs Determine impacts of inputs on output Analyze output sensitivities Quantify uncertainties of the output Multi-agency toll project financing negotiations Evolving risk analysis processes in T&R estimation 3
Planned Existing Forecasted Existing (MTP, CIP, etc.) Regional TDM Demand Supply Typical T&R Process Toll Diversion Model Toll Traffic/Transactions Transponder Shares, Revenue Recovery, Truck Shares, Revenue Days, Toll Rates Sensitivity Analysis Toll Revenue 4
Sensitivity Analysis A relatively common and reasonably effective method for accommodating risk in demand and revenue forecasts is the use of sensitivity analyses or “stress tests” (Kriger et al., 2006) Demonstrate impacts of changes to inputs Determine most and least influential inputs Test impacts of extreme events Estimate reasonable high and low Typically not a time-intensive process 5
Risk Analysis Typical Process Determine uncertainty distributions of inputs Model relationship between inputs and outputs Estimate output ranges/probabilities using multiple simulations (Monte Carlo) Sensitivities/elasticities are a by-product of risk analysis Challenges (in T&R risk analysis) Variables to include in risk analysis and correlations Quantification of uncertainty of inputs not easy Could lead to misleading conclusions Variables used for risk analysis Extreme events 6
Uncertainty Propagation Through TDM • Uncertainty drops at the traffic assignment model • Final flow uncertainties higher than levels of input uncertainties • More difficult to anticipate flows on uncongested networks According to Zhao and Kockelman (2002) Uncertainty grows through trip generation, trip distribution and mode choice models 8
Toll Road Freeways • Sub Area Network • Urban area highway model • AM, PM and OP time periods • 741 Zones (including 116 External Zones) • 4667 Roadway Links • 3106 Nodes • 816 Zone Connectors Case Study Model • Assumptions • Validated travel demand model • Commuter corridor • High toll transponder participation • Market share based toll diversion algorithm • No congestion pricing • Mostly developed corridor (Brownfield corridor) • Growth in trips to 2030 (1.6% annual growth) • No transportation improvements through 2030 Arterials 9
Sensitivity & Traffic/Transaction Probabilities 10 year Demographic Lag P5 of Population Toll Rates inflation of 5% per year P95 of Population Probability Probability ~ 23% P95 of VOC P5 of VOC 19
Sensitivity & Revenue Probabilities 10% increase in Revenue days 100% increase in Truck Shares P5 for Toll Rates P95 for Toll Rates 50% decrease in Revenue Recovery Probability ~ 44% P95 for Revenue days Probability P5 for Revenue days 20
Summary Quantification of T&R uncertainties very important given the inherent uncertainties/imperfections in inputs and models Possible ways to quantify T&R uncertainties Discrete sensitivity analysis Risk analysis to create probability ranges for the outputs Combined sensitivity analysis, risk analysis and extreme event impacts (recommended) Case study Subarea model to enable multiple Monte Carlo simulations Estimation of input variable uncertainties Estimation of T&R uncertainties using Monte Carlo simulations Sensitivity analyses, including extreme event impacts 23
Next Steps Quantification of T&R risks associated with Trip rates Modal splits Trip distribution parameters Volume delay functions Revenue recovery rates Toll facility “ramp-up” factors Toll diversion algorithm impacts Extent of sub-area model Managed lane facilities Greenfield facilities Correlation impacts of input variables 24
Phani Jammalamadaka pjammalamadaka@wilbursmith.com Questions? Yagnesh Jarmarwala yjarmarwala@wilbursmith.com Worapong Hirunyanitiwattana, PE whirunyan@wilbursmith.com Naveen Mokkapati, PE nmokkapati@wilbursmith.com 25