Download
1 / 71
720 likes | 877 Views
Managing Your Plantation. Module #2. Species and their roles Plantation dynamics Inventory Density Management Crop Planning. Managing Your Plantation. Topics. Typical plantations. Species & Their Roles. Mixtures. Pure blocks. red pine and white pine Jack pine and white pine

E N D
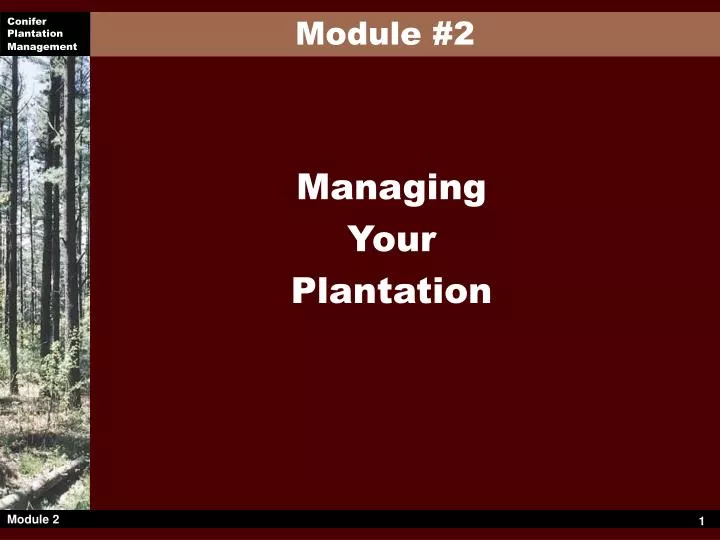
Managing Your Plantation Module #2
Species and their roles Plantation dynamics Inventory Density Management Crop Planning Managing Your Plantation Topics
Typical plantations Species & Their Roles Mixtures Pure blocks • red pine and white pine • Jack pine and white pine • other mixtures with hardwoods • red pine • white pine • white spruce • Norway spruce • Jack pine • white cedar
Excellent variety of forest products Nurse crop Usually single rotation Thin to maintain vigour Species & Their Roles Red Pine
Excellent array of forest products Nurse crop Component of next stand Susceptible to insects and diseases Species & Their Roles White Pine
Site protection and rehabilitation Nurse crop Subject to windthrow Limited product potential Not native to Southern Ontario Species & Their Roles Jack Pine
Species & Their Roles White Spruce • Good markets for pulp and sawlogs • Will be part of the continuing forest • Re-establish cover on wetter sites • Limbs can be tenacious
Good option for limestone sites Ability to capture site Species & Their Roles White Cedar • Planted mainly for wildlife habitat • Wide variety of products — cedar leaf oil, posts, grape stakes, sawlogs, pickets
Important Concepts… All forests change over time – growth, death, reproduction Land can support so much biomass Plantations tend to have trees that are similar in: Species Size (diameter/height) Age Plantation Dynamics
Plantation Dynamics • Trees grow! • What is the ‘right’ number of trees? • Do you have too many or too few? • Stocking • Too many – Overstocked • Too few - Understocked • Just right – Optimal Stocking
Trees will die if too crowded (OVERSTOCKED) Branches will be too big if too few trees (UNDERSTOCKED) Need to maintain optimum growing space for trees as they mature Thin for to maintain growth and vigour (IDEAL STOCKING) Properly managed forests produce the best forest products Plantation Dynamics
Initial spacing ~2,500 trees/hectare Final crop 200-300 trees/hectare Trees removed either by: Mother Nature You Plantation Dynamics
Forest Inventory • You need to know how your forest is doing • An inventory is a snapshot of your plantation at that time • Use the inventory information to determine what to do • Harvesting without an inventory is a BIG mistake
Forest Inventory How do I inventory my plantation? • All information is summarized on a per hectare basis • A series of plots are established in the plantation • Information on the trees within the plot is gathered • Must do more than 1 plot (the more the better!) • The results from each plot are averaged together 100 1 Hectare 100 100
Forest Inventory How do I ‘measure’ my plantation? • A circular plot of 5.64 meters radius is 1/100th of a hectare • Two types of data collected • Plot Data • The number of trees • The diameter of each tree • Stand data • The age of the plantation • The top or dominant height
Forest Inventory An example…. Mr. & Mrs. Smith own 10 ha of property that was planted 30 years ago with 25000 red pine seedlings • they put in 20 plots • they counted and measured the diameter of each tree in the plots • they measured the heights of 10 of the largest trees in the stand
Forest Inventory An example…. • Inventory Summary • Age = 30 years • Top Height = 15 meters • Average Diameter = 15.3 cm • Average # trees/Ha = 2400 • Species: 100% Red Pine 2-3
Density Management The DMD (Density Management Diagram) • relationship between tree numbers, height, diameter and volume • a planning tool to adjust tree numbers • Optimum growth on each stem • Increase financial return • when to thin • how many trees to remove
Density Management What you need to know about the DMD • Made up of several parts • We will look at each one • Need to use it systematically • A lot of science has gone into it ?
Parts of the DMD… Number of Trees • Inventory Summary • Age = 30 years • Top Height = 15 meters • Average Diameter = 15.3 cm • Average # trees/Ha = 2400 • Species: 100% Red Pine • Keep in mind the inventory from the Smith Plantation • X-axis = trees per ha • Logarithmic scale
Parts of the DMD… Number of Trees • There were 2400 trees per hectare • Originally planted at 2500 • some trees lost through mortality
Parts of the DMD… Average Diameter • Average diameter represented by upward sloped lines • 2 cm intervals • The dashed line represents the average diameter for the Smith Plantation
Parts of the DMD… Density/Diameter Relationship • Intersection point is important • Can use this point to estimate the average tree volume, management options etc.
Parts of the DMD… Average Tree Volume • Y-axis represents average tree volume • In this example the average tree volume is .12 cubic meters • What would the volume be per hectare? • Total stand volume?
Parts of the DMD… Stand Growth Lines A Crown closure line B Thin-to Line C Grow-to Line D Max. Density Line
Parts of the DMD… Stocking Zones • Three separate ‘zones’ • Indicates relative stocking • The Smith plantation is overstocked
What happens to a stand over time • Age is about 10 years • Crowns begin to touch • Site is fully occupied by trees • Lots of room for growth • Period of rapid growth begins
What happens to a stand over time • Grows into the zone of optimum stocking • ‘best’ growth rate
What happens to a stand over time • Trees start to out grow the site • Growth slows dramatically • Some trees are lost to stress
What happens to a stand over time • If left as is, this trend would continue • The ‘Mother Nature’ management approach
Open space Large crowns Large thick branches Space between trees under-utilized When is “wide” too wide Understocked Stands
Small crowns Susceptible to windthrow, insects, diseases Reduced product potential Limited management options Overstocked Stands
Larger diameters on fewer trees Increased product potential Healthy woodlot vigorous fights off insects and diseases minimizes ice storm damage Optimally Stocked Stands
Need to reduce the number of trees/ha Shooting for optimal stocking; i.e. between the Thin-to and Grow-to lines Ideal number is on the Thin-to line Maximizes the number of years between thinning Developing a Management Prescription How Many Trees Need to Come Out??????
Can’t draw a straight line across to the Thin-to line Thinning tends to increase average diameter Thinning does not increase dominant or top height Developing a Management Prescription
Height lines are curved Many stands won’t have the height listed in the DMD It is the curve (trend) that is important Developing a Management Prescription Parts of the DMD… Height Curves
Follow the height line back to the Thin-to line Project a line down to the X-axis (density) In this example the number of trees to be removed is about 1200 per hectare Developing a Management Prescription
If the stand is well overstocked, never cut more than 1/3 at any one time If the stand is near to, or at the Grow-to line, you can harvest more than 1/3 Developing a Management Prescription Should Mr. Smith thin 1200 stems/ha? overstocked Rule of 1/3
In this case the stand is well overstocked so Mr. Smith should only harvest 1/3 of the total # of stems 1/3=800 stems/ha Developing a Management Prescription Should Mr. Smith thin 1200 stems/ha? overstocked The prescription…. Harvest 800 stems/ha
We know… Trees are planted in rows We want to harvest 33% (1/3) of the stand So… Cutting every 4th row would be 25% That is about 600 trees/ha Still need another 200 trees/ha 200 trees is about 11% of the remaining trees (200/(2400-600)) This equalsabout 1 out of every 9 Developing a Management Prescription What does 800 trees/ha mean??
Mark for harvest every 4th row and approximately 1 out of every 6 trees in the remaining rows. Select smaller, damaged, poorer quality trees from within the rows Developing a Management Prescription The Final Prescription…
Volume per tree was .12 m3 Harvest prescription = 800 stems/ha Estimated harvest volume/ha … 800 * .12 = 96 cubic meters There are 10 ha Estimated Total Harvest Volume… 10 * 96 = 960 m3 Developing a Management Prescription How much volume….
Harvested logs are worth something Prices and markets vary considerably Most first thinnings are paid for by tonnage not number of stems Developing a Management Prescription How much is it worth…. • Currently… 1 tonne is worth ~$5 which is about $4.25 per m3 • Mr. Smith’s harvested trees are worth $4,590
Options limited by plantation design Take the worst and leave the best Adjust to circumstances Always refer to and update plan Remove enough to allow stand to maintain vigour First thinning must allow for future access — row thinning Some thoughts
Thinning increases average tree volume of remaining stems Some thoughts
First thinning ~25-30 years 15-20 cm average diameter (Dbh) up to 1/3 of the original stand every fourth row plus 1 tree out of 5- 6 on other rows First Thinning Summary B A
Mechanical row harvesting 1 row in 4 removed Trees/rows marked First Thinning Summary
We know what we have Now What will happen later? Crop Planning THE FUTURE
Second INVENTORY Age ~ 40 Trees/ha= 1600 Average Diameter = 18cm Crop Planning Second Thinning • Plot point on DMD to see where the stand ‘sits’ • Is it time to harvest?
selection system remove poorer quality stems release crop trees pulpwood, sawlogs may promote hardwood regeneration maintain health and vigour Crop Planning Second Thinning D C