Download
1 / 27
280 likes | 452 Views
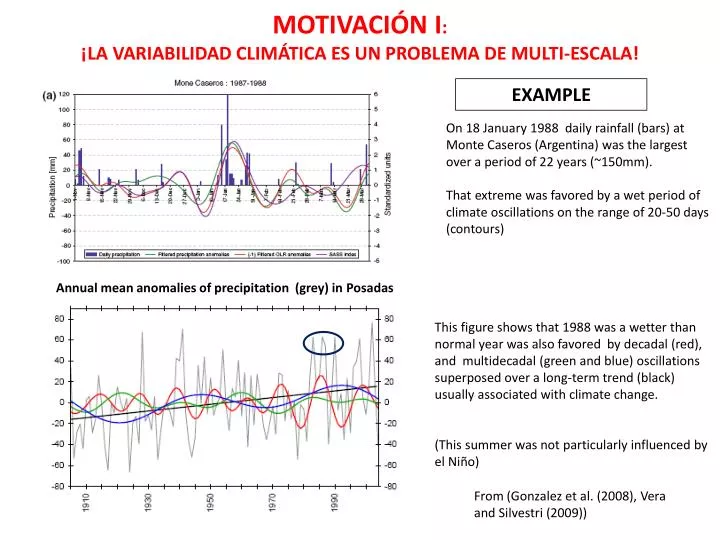
MOTIVACIÓN I : ¡LA VARIABILIDAD CLIMÁTICA ES UN PROBLEMA DE MULTI-ESCALA! . EXAMPLE. On 18 January 1988 daily rainfall (bars) at Monte Caseros (Argentina) was the largest over a period of 22 years (~150mm).

E N D
MOTIVACIÓN I: ¡LA VARIABILIDAD CLIMÁTICA ES UN PROBLEMA DE MULTI-ESCALA! EXAMPLE On 18 January 1988 daily rainfall (bars) at Monte Caseros (Argentina) was the largest over a period of 22 years (~150mm). That extreme was favored by a wet period of climate oscillations on the range of 20-50 days (contours) Annual mean anomalies of precipitation (grey) in Posadas This figure shows that 1988 was a wetter than normal year was also favored by decadal (red), and multidecadal (green and blue) oscillations superposed over a long-term trend (black) usually associated with climate change. (This summer was not particularly influenced by el Niño) From (Gonzalez et al. (2008), Vera and Silvestri (2009))
FUENTES DE VARIABILIDAD Y TELECONEXIONES Foco en el Sudeste de Sudamérica
GRUPO: DINAMICA DE LA VARIABILIDAD ATMOSFERICA SOBRE SUDAMERICA DESCRIPCIÓN Y ENTENDIMIENTO DE LA VARIABILIDAD GENERACIÓN DE HERRAMIENTAS DE MONITOREO GENERACIÓN DE HERRAMIENTAS DE PRONOSTICO VARIABILIDAD INTRAESTACIONAL VARIABILIDAD INTERANUAL VARIABILIDAD INTERDECADAL CAMBIO CLIMATICO • INTEGRANTES: • Directora: Carolina Vera • Colaboradores: Gabriel Silvestri, Bibiana Cerne, Marcela González • Estudiantes de doctorado: Mariano Alvarez, MaruSkansi, ClementineJunquas, Federico Robledo, Alejandro Godoy • Estudiantes de Licenciatura: Marisol Osman, Leandro Diaz
VARIABILIDAD INTRAESTACIONAL (10-90 días) DESCRIPCIÓN Y ENTENDIMIENTO DE LA VARIABILIDAD GENERACIÓN DE HERRAMIENTAS DE MONITOREO • FOCO EN: • Precipitación: Mariano Alvarez • Temperatura: Bibiana Cerne • Bajas segregadas: Alejandro Godoy (Claudia Campetella)
First EOF (S-mode, covariancematrix) of 10-90 day FOLR foreachseasonbetween 1980 and 2007. 10-90
Variabilidad intraestacional de la temperatura en Rosario Anomalías de temperatura (rojo) y la contribución de la variabilidad intraestacional (azul) - 1997
SON OSCILACIÓN DE MADDEN-JULIAN Fase 1 Fase 2 Fase 3 Fase 4 Fase 5 Fase 6 Fase 7 Fase 8
Zonal anomaly of streamfunction anomaly-PC1 regressionforeachseasonbetween 1980 and 2007. 10-90
CONDICIONES DE GRAN ESCALA QUE FAVORECEN LAS BAJAS SEGREGADAS
VARIABILIDAD INTERANUAL DESCRIPCIÓN Y ENTENDIMIENTO DE LA VARIABILIDAD GENERACIÓN DE HERRAMIENTAS DE MONITOREO GENERACIÓN DE HERRAMIENTAS DE PRONOSTICO • FOCO EN: • Modos de gran escala y variabilidad regional: Gabriel Silvestri, (Federico Robledo) • Predicción estacional: Marisol Osman (Marcela González)
NOV-DIC SAM ENSO Correlaciones de las anomalías de precipitación con el índice SAM (izquierda) y con EN3.4 (derecha)
Sistema de pronóstico estacional (SIPES) de la precipitación regional PARTE 1 PrecipitaciónObservada Construcción del ModeloEstadístico de Diagnóstico (MED) paraestimar la precipitación Variables AtmosféricasObservadas PARTE 2 PRONÓSTICOS DE DIFERENTES VARIABLES ATMOSFÉRICAS PRODUCIDOS POR MODELOS NUMÉRICOS GLOBALES PRONÓSTICOS PROBABILÍSTICOS DE LA PRECIPITACIÓN REGIONAL ESTIMACIONES DE LA PRECIPITACIÓN POR LOS MED PRECIPITACIÓN PRONOSTICADA Para el desarrollo del MED se utiliza la metodología de Análisis de CorrelaciónCanónicaque Indentifica los patronesquemaximizan la correlación entre uno o maspredictores y uno o maspredictando. PredictoresUtilizados en los meses de verano Geop en 500 hPa U y V en 850 hPa Indices de inestabilidad: Total Totals y K
Geop, V y K Index Modocanónico 1 Unavezencontrado los modos (no menos de dos) , se obtiene la precipitación proyectando los predictores en los modos
Validación del perfectprog C. I.: Noviembre Modelo: IFS-Hope Pronóstico: a 2 meses
Zona oeste de Córdoba y alrededores Estudio de tendencias de precipitación y predicción estacional de la lluvia. Zona Chaqueña: Interacción con COREBE, SRH, APA, SMN y Univ. San Luis. Estudio de tendencias de pp y su relación con cambios de uso del suelo y la dinámica social Predicción de precipitación estacional En cuenca del Bermejo COMAHUE: cuenca del Limay y del Neuquén Interacción con AIC, SRH y SMN Predicción de precipitación estacional Aplicación del modelo CPT Ciudad de Buenos Aires y alrededores Predicción de precipitación estacional Estudio de la influencia del Anticiclón del Atlántico PATAGONIA:en estudio Marcela Hebe González, noviembre 2011
VARIABILIDAD INTERDECADAL DESCRIPCIÓN Y ENTENDIMIENTO DE LA VARIABILIDAD GENERACIÓN DE HERRAMIENTAS DE PRONOSTICO • FOCO EN: • Variabilidad de la precipitación en la llanura pampeana e impacto en la agricultura: MaruSkansi • Variabilidad decadal e interdecadal en el Hemisferio Sur: Gabriel Silvestri • Validación de los modelos CMIP5 en clima presente y exploración de las predicciones para las próximas décadas: M. Skansi, G. Silvestri, L. Diaz,…
Decadal variations of the SAM signal on South America Climate Correlations SAM index-SLP and regressions SAM index-WIND850. Areas where correlations are statistically significant at the 90% (95%) of a T-Student test are shaded in light (dark) grey.
Decadal Variability (10-20 years) in the La Plata Basin Standardized anomalies of precipitation anomalies and SST principal components
Variabilidad de baja frecuencia del clima presente y futuro en el noreste de Argentina y su impacto en la producción agrícola
SeasonalTrendDecompositionusing Loess (STL) Cleveland et al 1990 Posadas Próximo se aplicará EmpiricalModeDecomposition (EMD) - Huanget al. 1998, Wu y Huang 2008
CAMBIO CLIMÁTICO DESCRIPCIÓN Y ENTENDIMIENTO DE LA VARIABILIDAD GENERACIÓN DE HERRAMIENTAS DE PRONOSTICO • FOCO EN: • Validación de los modelos del CMIP5 en representar la variabilidad interanual observada (EOF1): Leandro Diaz • Atribución del efecto antropogénico en la tendencia de precipitación observada en el siglo XX: Leandro Diaz, Alexis Hannart
Differences of DJF mean precipitation between (2079-2999) and (1979-1999) 18 Models from WCRP/CMIP3 dataset SRESA1B Scenario 18-Model ensemble
Leading pattern (EOF1) of DJF rainfall anomaly variability from the 18 models Period: 2001-2099 Scenario: SRESA1B
Mean number of positive and negative EOF1-SE Increment of wetter than normal DJFs in the la Plata Basin Decrease of drier than normal DJFs in the la Plata Basin
Composite differences of mean DJF SST anomalies between positive and negative EOF1 events from the 9-model ensemble mean (A) 2001-2049 (B) 2050-2099