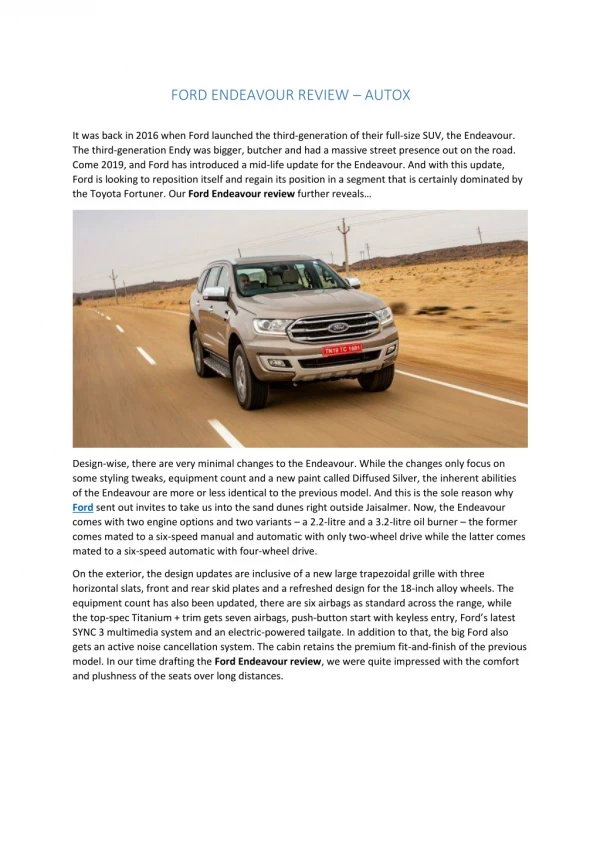
Download
1 / 28
340 likes | 462 Views
The Scientific Endeavour. Chp 1. Topics. Introduction to Scientific Knowledge Scientific Experiments Linear Graphs Thinking deeper about Scientific Knowledge. Scientific Knowledge. Qn: How many branches of science are there? Ans : there are hundreds What is scientific knowledge?

E N D
The Scientific Endeavour Chp 1
Topics Introduction to Scientific Knowledge Scientific Experiments Linear Graphs Thinking deeper about Scientific Knowledge
Scientific Knowledge Qn: How many branches of science are there? Ans: there are hundreds What is scientific knowledge? Textbook answer: scientific knowledge is knowledge gained through scientific experimentation and observation Main points: Science describes the physical universe Scientific knowledge is obtained through a rigorous and systematic process (involving scientists)
Is this science? So does this mean that traditional Chinese Medicine, Acupuncture, Foot Reflexology, etc. is NOT TRUE AT ALL?
In Your Textbook (read urself) Attitudes required of a scientist (story of Mpemba) “The Scientific Method” – how scientific knowledge is gained
Forming & Testing Hypotheses The word “hypothesis” (plural: hypotheses) is a very important word to scientists A hypothesis is a guess a scientist makes A good hypothesis must be able to make predictions, and these predictions can be tested
Hypothesis Making Recently, I made the following hypothesis: The younger the student, the more time spent on twitter but less time spent on facebook Why did I make this hypothesis? Qn: is this a scientific hypothesis? Does this hypothesis make predictions? Can these predictions be tested?
HOMEWORK – Hypothesis Making Exercise I want you to go home and come up with your own original hypothesis Include the following: What is your Hypothesis? Why did you suspect this hypothesis to be true? How can you test this hypothesis?
HOMEWORK – Hypothesis Making Exercise Your hypothesis must be able to be tested easily in school The testing of your hypothesis may involve your classmates but shouldn’t involve others outside your class Deadline: Submit Next Lesson Remember my late work policy I will choose the 5 best hypotheses submitted and test these hypotheses in class
Hypothesis The younger the student, the more time spent on twitter but less time spent on facebook is an example of a hypothesis in the social sciences Even if the hypothesis is true, the predictions can never be 100% accurate. E.g. not every young student will spend more time on twitter than every old student But predictions made in Physics or Chemistry are expected to be 100% accurate. That is why sometimes these subjects are called “hard sciences” What about biology?
Scientific Experiments We will now move away from the social sciences and focus more on the “hard sciences” In these fields, we try to make hypotheses with either increasing trends or decreasing trends “The more I increase/decrease X, the more Y will increase/decrease”
Scientific Experiments From your notes: rolling a water bottle down a ramp Hypothesis: the greater the volume of water, the longer it takes to roll down the ramp Is this a good hypothesis? Does it make predictions? Can the predictions be tested? How should we test these predictions? Do we just want to do the experiment once?
Scientific Experiments Hypothesis made with increasing or decreasing trends allow for multiple predictions, which we call multiple data points E.g., I can do one try with only 100 ml of water, one with 200 ml of water, one with 300 ml of water, etc. Experiments with multiple data points are considered to be more rigorous compared with experiments with only one data point (but sometimes experiments with one data point are still necessary, especially in the social sciences)
Scientific Experiments How do we design and conduct an experiment with multiple data points? Need to understand 3 important concepts: 1) Independent Variable 2) Dependent Variable 3) Controlled Variable
Independent Variable The word “variable” means something which can be changed The independent variable in an experiment, is what is intentionally being changed in order to conduct the experiment In the water bottle and ramp experiment, what is the independent variable? Qn: Should we be measuring the independent variable?
Dependent Variable A dependent variable is something which naturally changesas a result of the independent variable being changed Usually, the dependent variable is what we’re most interested in in the experiment. In the water bottle and ramp experiment, what is the dependent variable?
Independent and Dependent Variables How do we remember which one is which? What does the English words “dependent” and “independent” mean? The dependent variable depends on the independent variable. The independent variable does not depend on the dependent variable.
Controlled Variables Controlled Variables are variables which are kept constant (i.e. controlled) while the multiple data points are being collected If these variables are not kept constant, the readings would not be accurate In the bottle and ramp experiment, what are some controlled variables? There is usually a very long list of controlled variables, but some are more important than others.
Graphs In science, we usually use graphs to represent our experimental results, especially when we predict an increasing or decreasing trend In this part of the lesson, you will learn the various parts of a graph, and how to plot a graph when given the experimental results You will need a pencil & a 30 cm long ruler
Table of Values During an experiment, we would measure and record down the values of both the independent and dependent variables Consider this experiment: I want to investigate how much mass of water evaporates with time when I shine a hot lamp on it What is the independent variable? What is the dependent variable? The table in the next slide records the data from this experiment. The mass is given the symbol “m” and the time is given the symbol “t”
Parts of a Graph m / g t / s
Before Plotting A Graph The dependent variable is on the vertical axis The independent variable is on the horizontal axis Your vertical axis and horizontal axis must be labelled (symbol / units)
Choosing Scale of Axes Sometimes the scale of the axes are already given to you (e.g. 2 cm represents 20 seconds) Other times you are required to determine the scale yourself. This is usually a difficult task There are two rules for choosing scale Rule 1: each 2 cm box may only represent denominations of 1, 2 or 5 Rule 2: the range of data must take up at least half the graph paper provided
Choosing Scale of Axis How to check if your data takes up at least half of graph paper? Step 1) Try out one axis first Step 2) Plot the first and last data points of that axis Step 3) Count the number of big squares taken up between these 2 data points Step 4) If this number is at least half of the total number of big squares, your scale is good. If not, repeat Step 1 again with a different scale
Plotting the graph Use a small cross “x” to plot your data points After you plot the point, check one more time against the table to make sure that you did not plot wrongly
Plotting Best Fit Line At lower sec, most of the time, you will be asked to plot straight lines Occasionally, you will be asked to plot curves (we will cover this when we get to it) When you are asked to plot a straight line, the graph is said to be a “linear graph” Sometimes, the data points do not fall neatly into a straight line. There can be many reasons for this (e.g. experimental error, lack of accuracy in measurements, etc.) When that happens, you will be required to plot a best fit line