Download
1 / 29
290 likes | 554 Views
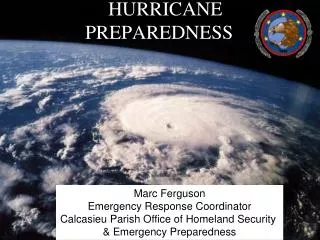
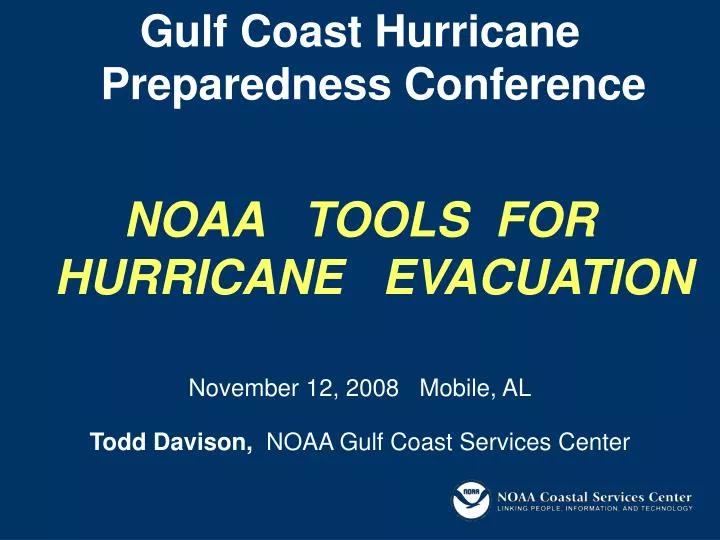
Gulf Coast Hurricane Preparedness Conference NOAA TOOLS FOR HURRICANE EVACUATION. November 12, 2008 Mobile, AL. Todd Davison, NOAA Gulf Coast Services Center. Customer Focused. Technology Experts. Where we’re required to be. Role of CSC. Acting as the “Middle-man”.

E N D
Gulf Coast HurricanePreparedness Conference • NOAA TOOLS FOR HURRICANE EVACUATION November 12, 2008 Mobile, AL Todd Davison, NOAA Gulf Coast Services Center
Customer Focused Technology Experts Where we’re required to be Role of CSC Acting as the “Middle-man” • Must know the customer as well as the technology (have to straddle the fence) • Effectively “buying down the cost” for coastal information and tools
NOAA Coastal Services Center http://www.csc.noaa.gov Coastal Hazards Theme:Provide emergency/floodplain managers with GIS-based coastal hazard tools and spatial data that will assist them in mitigating against, responding to, and recovering from the impacts of coastal hazards • Customers: State and Local Coastal Resource Managers • Emergency managers • Floodplain managers • Protected areas • Coastal planners • Regulatory agencies • Fish and wildlife agencies • Estuarine reserves • Sea Grant programs • Educators
National View Total: 194 Federal: 83 Non-federal: 111 # # # New England 3 San Francisco Area 3 # Annapolis 2 Norfolk 1 D.C. 10 Charleston 153 # # Honolulu 17 # Stennis Space Center 8 Miami 1
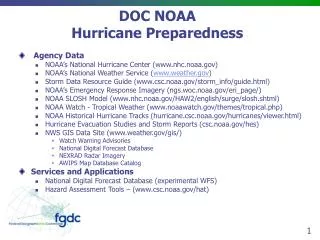
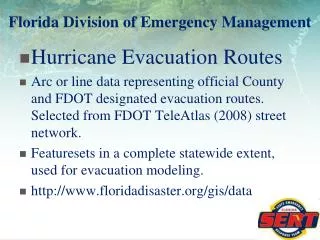
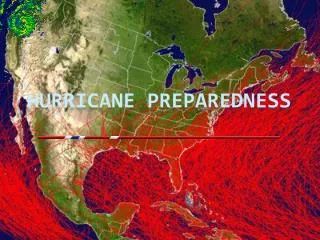
Hazards Toolkit Mapping tools and templates, Training Courses, Visualization Techniques, Methodologies and Best Practices, and Data Resources. • Historical Hurricane Tracks Tool • Storm Information Products • NWS Flood Severity Mapping • Storm Surge Remapping Model • Storm Surge Visualization • Hurricane Evacuation Zone Maps
Storm Data Resource Guide Storm Mapping Tutorial Storm Information Website www.csc.noaa.gov/storm_info/ Helping you find the data and tools needed before, during, & after a storm.
Storm Mapping Tutorial A series of 13 modules that can: • aid emergency and coastal managers during hurricanes…. • by showing how to find and use NOAA meteorological and hydrological data…. • and stepping through GIS procedures to generate map products that address storm-related hazards.
Storm Mapping Tutorial Example Application and Map Product + NHC graphical hurricane track forecast NWS graphical forecast
Storm Mapping Tutorial Final Product Examples Storm Track & Imagery Forecast Windspeed SLOSH model data Flash Flood Guidance
HURREVAC Inland Flood Planning and Response Tool Inland Flood Tools added to HURREVAC for Coastal States from Texas to Maine, Puerto Rico and the U.S. Virgin Islands Rain / River Drop-down Menu Provides 24 hour QPF forecasts, affected area lists, and river flood outlook products River Gage Data Display River gage observations and forecasts Hydrograph at Forecast Points Observed and forecast data at NWS river forecast points includes historical crests and flood impacts Q3 and DFIRM Maps at forecasts Points 24,000 scale maps at river forecast points for 100 and 500 year flood inundation for FEMA Region IV
HURREVAC Quick Reference Guide • Collaboration with FEMA Region IV • Provides quick reference to Government Officials on HURREVAC functionality • Highlights GIS functionality and using NOAA forecast data • Available on Hurricane Preparedness Website http://www.nhc.noaa.gov/HAW2/pdf/hurrevac_guide.pdf
HURREVAC Storm Surge Module Available through tide gages Features -Exercise mode - SLOSH forecast mode - 20% error margin - Gage marked with S when real time data available
Flood Severity Mapping • Visualize NWS flood categories • Display potential flood inundation for each of the NWS categories • Flood Stage and below • Minor Flooding • Moderate Flooding • Major Flooding, including Flood of Record • Graphical depiction of flood risk and impacted areas
Flood Severity Mapping • Show inundation extent, water depth, & flood categories • 16 locations in North Carolina now on website • 35 locations for Gulf of Mexico region will be on website in the next year • Partnering with FEMA Map Modernization program to decide which region to look at next
Comprehensive Hurricane Preparedness Study • CHPS expands on Hurricane Evacuation Study. • Chatham County, GA Pilot • Remap Storm Surge Zones – GIS model • Map Shallow Coastal Flooding • Data Access for multiple county agencies • Center will work with other states/counties to acquire, set up, and run the model.
Mapping Storm Surge Zones • GIS model uses a DEM and SLOSH model MOMs to determine surge extent for each Saffir-Simpson hurricane category (1 to 5) • Model output is a shapefile representing the horizontal extent of surge for a category • Remapped surge zones • redefine evacuation zones • recalculate clearance times • more efficient evacuations and planning
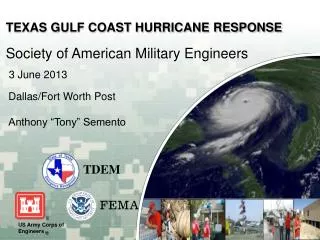
Pilot Project Area Hurricane Ivan Impact Area Improving Inundation Mapping and Tools – A Gulf Coast Pilot Project Objectives: • Assess needs of management community • Assemble needed data • Test a prototype storm surge model (hindcast Ivan) • Improve inundation mapping • Develop mapping and educational products ADCIRC model
Digital Elevation Model • Mapping inundation starts with base DEM • Quality of output highly dependent on quality of DEM • Created from bare earth lidar • Integrated bathymetry from model mesh to create a seamless topobathy surface • Downloaded from LDART • Flew lidar for Walton, Escambia, and Santa Rosa Counties • maps.csc.noaa.gov/TCM/
Hurricane Evacuation Zones Tool • Purpose • Provide a template for emergency managers to easily supply the public with evacuation zone information • Template • Demonstrated on the Center website as an example application for a fictitious community • Access • Template (code) and set-up documentation available upon request to federal, state, and local officials
Application: Address Search Page • Sample addresses • Default code is parcel search (option for geo-coded streets)
Application: Map Display • Simple mapping interface • Evacuation zone display is specific to searched address • Option to view all evacuation zone definitions
Hazards Toolkit: Hurricane Related Resources • Historical Hurricane Tracks Tool • hurricanes.csc.noaa.gov/hurricanes • Storm Information Products • www.csc.noaa.gov/storm_info • NWS Flood Severity Mapping • www.nws.gov/ahps • Storm Surge Remapping Model • Hurricane Evacuation Zone Maps Tool/Template • www.csc.noaa.gov/hez_tool • Storm Surge Visualization
Contact Info. Billy Brooks: william.brooks@noaa.gov 843.740.1319 Tara Miller: tara.miller@noaa.gov 843.740.1251 Ethan Gibney: ethan.gibney@noaa.gov 305.229.4458 Tina Sanchez: tina.sanchez@noaa.gov 228.688.2345