Download
1 / 20
200 likes | 309 Views
Validation of Storm Surge Models for the New York Bight and Long Island Regions and the Impact of Ensembles. Tom Di Liberto Dr. Brian A. Colle Stony Brook University. Motivation. How well can a surge (ocean) model do for landfalling hurricanes over the Northeast U.S.?

E N D
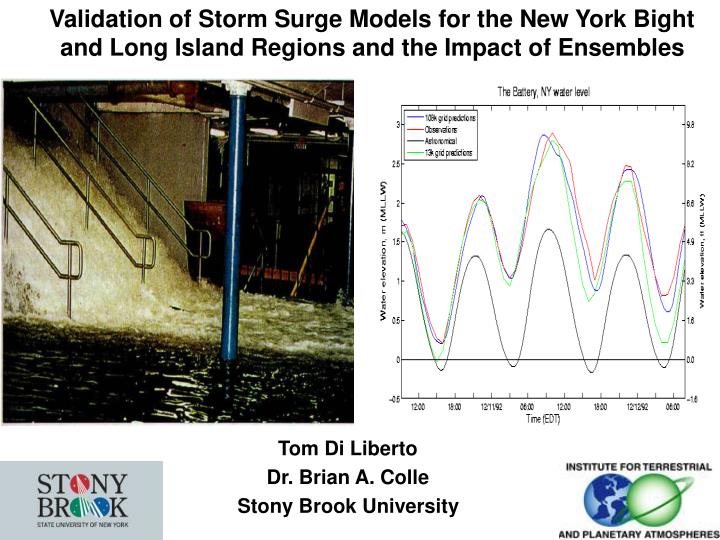
Validation of Storm Surge Models for the New York Bight and Long Island Regions and the Impact of Ensembles Tom Di Liberto Dr. Brian A. Colle Stony Brook University
Motivation • How well can a surge (ocean) model do for landfalling hurricanes over the Northeast U.S.? • What is the skill of the Stony Brook Storm Surge system over the cool season? How does it compare with other models (NOAA and Stevens Institute)? • What are the strengths and current limitations of ensemble surge modeling?
MM5/WRF Modeling of Gloria /ADCIRC Modeling of Storm Surge MM5 / WRF ADCIRC 36 km 12 km 4 km • NCAR-AFWA Bogus Method • YSU PBL, GFS PBL, MY PBL runs • NARR initial condition • 108 K nodes ( 70km to 5 m) • Ensemble uses 5 MM5 / 3 WRF members
NARR Initial Conditions Lin Microphysics YSU PBL Landfall occurs ~ 1 h delayed ~30 miles east of observed landfall
Gloria Tracks PBL PBL PBL NCAR-NCEP Global Reanalysis IC
Wind Speed kts Wind Speed kts
CREATE ANIMATION OF YSU 10m 1.0x YSU PBL
Observed Landfall What if GFS PBL scheme 1 h shifted? * Model Landfall 1 h shift of track increases peak water level by ~.20m Using 30m wind increases peak water level by ~.30m Using different PBL (track) increases peak water level by ~.40m
Wave and Surface Stress Impact SWAN wave model used to calculate wave radiation stress Wave model takes winds from atmospheric runs to generate waves
5 MM5 / 3 WRF members • MM5/WRF run at 12 km resolution, once a day at 00z and ADCIRC runs out 48 h. • stormy.msrc.sunysb.edu
Real-time Modeling Systems Compared • Stevens Institute • Atmospheric Forcing – 12-km NAM • Ocean Model – POMS • http://hudson.dl.stevens-tech.edu/maritimeforecast/ • NOAA ET Surge • Atmospheric Forcing – GFS • http://www.weather.gov/mdl/etsurge/ • Stony Brook Storm Surge Model • Atmospheric Forcing – MM5/WRF • Ocean Model - ADCIRC Ocean Model • http://stormy.msrc.sunysb.edu/
Real Time Ensemble • 36 days during Nov. 2007 – March 2008 with Full Ensemble • Nov – 9 days • Dec – 12 days • Jan – 15 days
Wave Impacts during Cool Season • SBSS model member 9a • Average daily errors from Nov 2007- March 2008 • Correlation Coefficient = -.4711
Stevens Institute Stevens Institute
1 – GRMRF.NEUS.eta (9a) 2 – 221.YSU.KFE.FERR.RRTM 3 – BMMY-CCM2.NEUS.avn 4 – GFS.YSU.GRE.FERR.RRTM 5 – GRBLK-CCM2.NEUS.nogaps 6 – K2MRF-Reis.NEUS.avn 7 – K2MY-CCM2.NEUS.cmc 8 – NOG.YSU.BMJ.WSM3.RRTM 1 – GRMRF.NEUS.eta (9a) 2 – 221.YSU.KFE.FERR.RRTM 3 – BMMY-CCM2.NEUS.avn 4 – GFS.YSU.GRE.FERR.RRTM 5 – GRBLK-CCM2.NEUS.nogaps 6 – K2MRF-Reis.NEUS.avn 7 – K2MY-CCM2.NEUS.cmc 8 – NOG.YSU.BMJ.WSM3.RRTM
Conclusions • Gloria: • WRF-ADCIRC underestimated the surge even after adjusting winds to 30-m ASL. • A small change in the track related to a different PBL (GFS rather thanYSU) and a small timing adjustment (1-h) resulted in a better peak water levelforecast. • There are also relatively large sensitivities to surface stress andwaves in the ocean model. • Real-time Verification • Stevens Institute Surge modeling system has smaller mean and root mean square errors than NOAA ET and Stony Brook surge models. Negativesurge mean errors in the SSBS system may be related to the absence of waveforcing and/or a low wind bias over the water. • Stony Brook surge ensemble is under-dispersed and shares many(negative) biases, even for members that have different wind biases.Suggests the need for multi-model surge models in operations (not justdifferent atmospheric forcings) and surge bias corrections. • Need a larger sample to obtain some probabilistic verification.