Download
1 / 20
200 likes | 335 Views
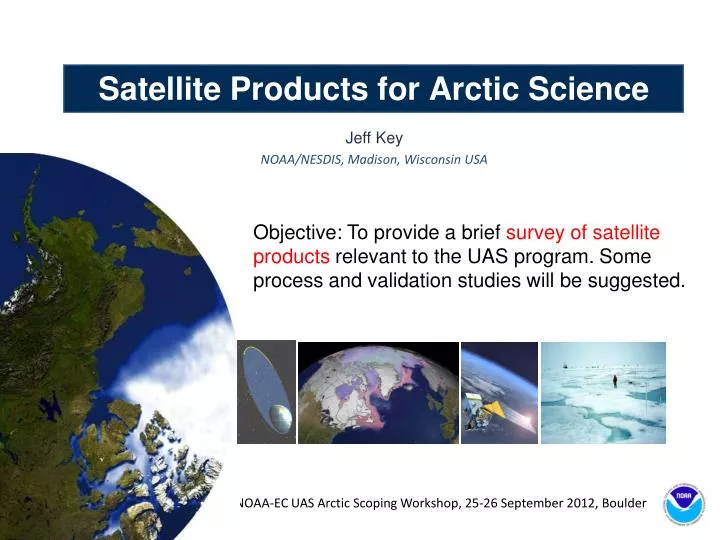
Satellite Products for Arctic Science. Jeff Key NOAA / NESDIS, Madison, Wisconsin USA. Objective: To provide a brief survey of satellite products relevant to the UAS program. Some process and validation studies will be suggested.

E N D
Satellite Products for Arctic Science Jeff Key NOAA/NESDIS, Madison, Wisconsin USA Objective: To provide a brief survey of satellite products relevant to the UAS program. Some process and validation studies will be suggested. NOAA-EC UAS Arctic Scoping Workshop, 25-26 September 2012, Boulder
Satellite Products and the UAS Program Satellite data can • Help guide flight planning by identifying areas with surface and atmopheric characteristics of interest • Contribute to process studies in combination with UAS data UAS observations can provide critical information, or “truth”, for the validation of satellite products.
Satellite Products for Sea Ice Forecasting: Prioritized Product List This list was compiled at the NOAA Sea Ice Forecasting Workshop, September 2011, Anchorage • Ocean • SST • Currents • Salinity • Waves • Atmosphere • Temperature/humidity profiles (radiances) • Surface winds • Tropospheric winds • Surface air temperature • Surface radiation • Cloud cover Ice • Ice extent and concentration • Ice age/type • Ice thickness • Ice motion • Ice surface temperature (skin) • Snow on ice - depth and density • Leads and polynyas • Ice roughness, ridges • Shorefast ice • Floe size distribution; marginal ice zone
Imagery VIIRS IR (11.5 m) animation from consecutive overpasses of Suomi NPP over Prince Patrick Island (located in the far northwestern portion of the Canadian Arctic Archipelago) on 28 April 2012.
Temperature and Humidity Profiles from AIRS Profiles from hyperspectral instruments are high vertical resolution that should improve retrievals of temperature inversions Tiksi 10 September 2012
Low-Level Atmospheric Temperature Inversions Strength (C) Depth (m) January July
Polar Winds There is a significant positive impact on forecasts from the assimilation of polar wind data, not just for the Arctic and Antarctic, but also for the extratropics of both hemispheres. Northern Hemisphere Impact at 500 hPa (ECMWF) Above: Winds from AVHRR data collected at Barrow on 17 Sept 2012
MODIS Cloud Properties Above: cloud particle phase, 17 Sept 2012 Left: Cloud top pressure (Generated at Sodankylä, Finland)
Cloudsat-CALIPSO Clouds Latitude-height representation of an ice cloud observed by both (a) the CloudSat radar and (b) CALIPSO lidar 13 October 2006 between 03:52 and 03:58 UTC. The presence of supercooled layers is indicated by red boxes, where a strong lidar echo is observed while the radar echo is very weak. (c) The result of our categorization. (Delanoe and Hogan, JGR, 2010)
Atmospheric Composition and Aerosol Measurements • Satellite measurements include: • Total column O3, NO2, NO2, NO, CO, BrO, HcL • Profiles of O3, CO • Aerosol optical depth Total vertical column bromine (BrO) observations from GOME-2 (on MetOP-A) for 23:59Z and 15:30Z (24-hr averages) on April 8, 2008. Arctic boundary layer BrO enhancements lead rapid ozone loss within the Arctic boundary layer. (GOME-2 data provided by Trevor Beck, NOAA/NESDIS)
Ice Surface Temperature Ice Motion Surface Albedo
Sea Ice Leads The reflectance at 0.64 m from MODIS (upper left), mask of leads derived using group thresholds method (upper right), distributions of lead segment width (lower left), and lead segment orientation (lower right) based on the mask of leads. The scene is over the Beaufort and Chukchi Seas on March 11, 2009.
River Ice Different ice cover and ice types along the Lower Red River, Manitoba, for winter 2009 – 2010 (left ) and winter 2010 – 2011 (right) inferred from RADARSAT-2 SAR image analysis.
Snow Cover Global gridded VIIRS snow map gives a realistic estimation of snow cover. Similar products are available from other sensors. Feb 22, 2012 Snow Land 0.5 km spatial resolution 20 km Cloud
Snow Water Equivalent (AMSR-E) Feb 2010 Nov 2010 Mar 2010 Apr 2010
Summary of Satellite Products • Atmosphere • Temperature/humidity profiles • Surface winds (ocean) • Tropospheric winds • Temperature inversions • Surface radiation • Cloud cover • Cloud phase, particle size, height • Cloud optical depth • Aerosol optical depth (over land) • Solid precipitation • Trace gases • Not discussed • Glaciers, ice sheets, ice caps • Ocean (SST, currents, salinity, waves) Snow Snow cover Snow water equivalent Snow depth Ice Ice extent and concentration Ice age/type; Ice thickness Ice motion Ice surface temperature Ice albedo Snow depth on ice Leads and polynyas Land, Permafrost Land surface temperature Soil moisture Ground movement Vegetation index (Green: mature capability; Blue: moderate/developing capability; Red: little or no capability)
Potential Studies Process Studies • Sea ice leads – width distributions, ice thickness, fluxes. To study scale differences in lead statistics and the impact of leads on local meteorology. A mini LeadEx (1992). • Arctic cloud properties – To study small-scale variability, formation processes (advection, surface evap, etc.) and feedbacks (?), ice crystal precipitation, and for the satellite validation. • Storms - Impact of storms on sea ice Satellite Validation • Surface temperature, albedo, and radiation – To study small-scale variability (melt ponds). • Boundary layer – To study fine-scale vertical structure and spatial variability over a satellite footprint. • Tropspheric winds • Sea ice thickness? • Snow depth on ice?