Download
1 / 42
420 likes | 500 Views
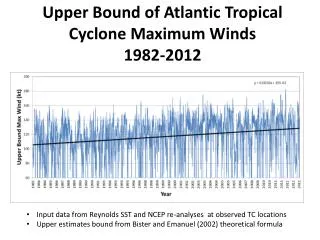
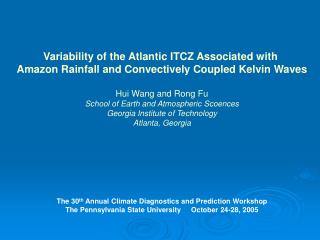
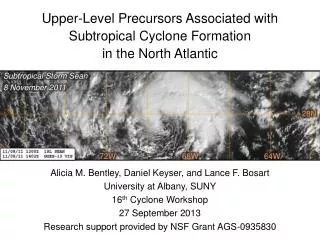
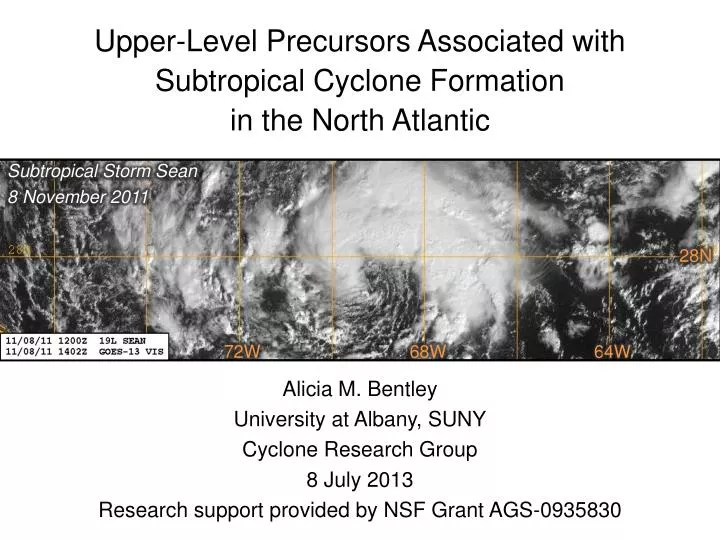
Upper-Level Precursors Associated with Subtropical Cyclone Formation in the North Atlantic. Subtropical Storm Sean 8 November 2011. 28N. 72W. 68W. 6 4 W. Alicia M. Bentley University at Albany, SUNY Cyclone Research Group 8 July 2013 Research support provided by NSF Grant AGS-0935830.

E N D
Upper-Level Precursors Associated with Subtropical Cyclone Formation in the North Atlantic Subtropical Storm Sean 8 November 2011 28N 72W 68W 64W Alicia M. Bentley University at Albany, SUNY Cyclone Research Group 8 July 2013 Research support provided by NSF Grant AGS-0935830
Subtropical Cyclones Operational Definition • “A non-frontal low-pressure system that has characteristics of both tropical and extratropical cyclones.” • “Unlike tropical cyclones, subtropical cyclones derive a significant portion of their energy from baroclinic sources…often being associated with an upper-level low or trough.” − National Hurricane Center Online Glossary (2012)
Adapt Davis (2010) Methodology • Davis (2010) methodology: • Based on Ertel potential vorticity (PV) • Formulated in terms of two PV metrics that quantify the relative contributions of baroclinicprocesses and condensation heating to the evolution of individual cyclones • Davis (2010) methodology is similar to Hart (2003) cyclone phase space diagrams
Adapt Davis (2010) Methodology • Lower-troposphericbaroclinic processes:(near-surface potentialtemperature anomaly) 425 hPa Potential temperature anomaly Length of 6° of latitude absolute vorticity
Adapt Davis (2010) Methodology • Lower-troposphericbaroclinic processes:(near-surface potentialtemperature anomaly) • Midtroposphericlatent heat release:(interior PVanomaly) 425 hPa Potential temperature anomaly Length of 6° of latitude absolute vorticity Ertel PV anomaly PV1/PV2 : measure of the contribution of lower-troposphericbaroclinic processes relative to the contribution of condensation heating
Adapt Davis (2010) Methodology 200 hPa 925 hPa
Adapt Davis (2010) Methodology • Lower-troposphericbaroclinic processes:(near-surface potentialtemperature anomaly) 200 hPa 925 hPa Lower-tropospheric baroclinic processes (PV1)
Adapt Davis (2010) Methodology • Lower-troposphericbaroclinic processes:(near-surface potentialtemperature anomaly) • Midtroposphericlatent heat release:(interior PV anomaly) 200 hPa 925 hPa Lower-tropospheric baroclinic processes (PV1)
Adapt Davis (2010) Methodology • Lower-troposphericbaroclinic processes:(near-surface potentialtemperature anomaly) • Midtroposphericlatent heat release:(interior PV anomaly) 200 hPa 500 hPa Midtroposphericlatent heat release (PV2) 925 hPa Lower-tropospheric baroclinic processes (PV1) PV1/PV2 : measure of the contribution of lower-tropospheric baroclinic processes relative to the contribution of condensation heating
Adapt Davis (2010) Methodology • Introduce additional metric to diagnose upper-tropospheric dynamical processes • Upper-troposphericdynamical processes:(upper-tropospheric PV anomaly) Ertel PV anomaly 300 hPa Length of 6° of latitude
Adapt Davis (2010) Methodology • Lower-troposphericbaroclinic processes:(near-surface potentialtemperature anomaly) • Midtroposphericlatent heat release:(interior PV anomaly) 200 hPa 500 hPa Midtroposphericlatent heat release (PV2) 925 hPa Lower-tropospheric baroclinic processes (PV1) PV1/PV2 : measure of the contribution of lower-troposphericbaroclinic processes relative to the contribution of condensation heating
Adapt Davis (2010) Methodology • Lower-troposphericbaroclinic processes:(near-surface potentialtemperature anomaly) • Midtroposphericlatent heat release:(interior PV anomaly) • Upper-troposphericdynamical processes:(upper-tropospheric PV anomaly) Upper-troposphericdynamical processes(PV3) 200 hPa 500 hPa Midtroposphericlatent heat release (PV2) 925 hPa Lower-tropospheric baroclinic processes (PV1) PV1/PV2 : measure of the contribution of lower-troposphericbaroclinic processes relative to the contribution of condensation heating
Adapt Davis (2010) Methodology • Lower-troposphericbaroclinic processes:(near-surface potentialtemperature anomaly) • Midtroposphericlatent heat release:(interior PV anomaly) • Upper-troposphericdynamical processes:(upper-tropospheric PV anomaly) • Vertical wind shear Upper-troposphericdynamical processes(PV3) 200 hPa 300 hPa Vertical wind shear 500 hPa Midtroposphericlatent heat release (PV2) 925 hPa Lower-tropospheric baroclinic processes (PV1) PV1/PV2 : measure of the contribution of lower-troposphericbaroclinic processes relative to the contribution of condensation heating
Case Study • STC Sean (2011)(6 November – 12 November) • Track • Time series of PV1–PV3 and PV1/PV2 during tropicaltransition (TT) Images created using 0.5° Climate Forecast System Reanalysis v2 (CFSR v2) dataset
STC Sean (2011): Track Tropical cyclone Subtropical cyclone Extratropical cyclone / Remnant low TS Seanreclassified asan“extratropical low pressure system”0000 UTC 12 Nov Officially tracked by NHC as an “extratropical low pressure system”0000 UTC 6 Nov Tropical Storm Sean1800 UTC 8 Nov Subtropical Storm Sean0600 UTC 8 Nov Image courtesy of the National Climatic Data Center
STC Sean (2011): Adapted Davis (2010) Upper-troposphericdynamical processes(PV3) 200 hPa 300 hPa PV metrics and vertical wind shear values calculated from 0.5° CFSR v2 dataset Vertical wind shear 500 hPa Midtroposphericlatent heat release (PV2) 925 hPa Lower-tropospheric baroclinic processes (PV1) PV1/PV2 : measure of the contribution of lower-troposphericbaroclinic processes relative to the contribution of condensation heating
STC Sean (2011): Adapted Davis (2010) Calculation Location 1200 UTC 6 November 2011 925–300-hPa vertical wind shear:24.6 m s−1 PV3 PV2 T1 PVU PV1/PV2 PV1 PV1 PV2 9 Nov 7 Nov 6 Nov 8 Nov 10 Nov 12 Nov 11 Nov DT potential temperature (shaded, K), 925–850-hPa layer-averaged cyclonic relative vorticity (black contours every 0.5 × 10⁻⁴ s−1)
STC Sean (2011): Adapted Davis (2010) Calculation Location 1200 UTC 7 November 2011 925–300-hPa vertical wind shear:13.6 m s−1 PV3 PV2 PVU PV1/PV2 PV1 PV1 PV2 9 Nov 7 Nov 6 Nov 8 Nov 10 Nov 12 Nov 11 Nov DT potential temperature (shaded, K), 925–850-hPa layer-averaged cyclonic relative vorticity (black contours every 0.5 × 10⁻⁴ s−1)
STC Sean (2011): Adapted Davis (2010) Calculation Location 1200 UTC 8 November 2011 925–300-hPa vertical wind shear:10.3 m s−1 PV3 PV2 PVU PV1/PV2 PV1 PV1 PV2 9 Nov 7 Nov 6 Nov 8 Nov 10 Nov 12 Nov 11 Nov DT potential temperature (shaded, K), 925–850-hPa layer-averaged cyclonic relative vorticity (black contours every 0.5 × 10⁻⁴ s−1)
STC Sean (2011): Adapted Davis (2010) Calculation Location 1200 UTC 9 November 2011 925–300-hPa vertical wind shear:13.9 m s−1 PV3 PV2 PVU PV1/PV2 PV1 PV1 PV2 9 Nov 7 Nov 6 Nov 8 Nov 10 Nov 12 Nov 11 Nov DT potential temperature (shaded, K), 925–850-hPa layer-averaged cyclonic relative vorticity (black contours every 0.5 × 10⁻⁴ s−1)
STC Sean (2011): Adapted Davis (2010) Calculation Location 1200 UTC 10 November 2011 925–300-hPa vertical wind shear:12.9 m s−1 PV3 PV2 T2 PVU PV1/PV2 PV1 PV1 PV2 9 Nov 7 Nov 6 Nov 8 Nov 10 Nov 12 Nov 11 Nov DT potential temperature (shaded, K), 925–850-hPa layer-averaged cyclonic relative vorticity (black contours every 0.5 × 10⁻⁴ s−1)
STC Sean (2011): Adapted Davis (2010) Calculation Location 1200 UTC 11 November 2011 925–300-hPa vertical wind shear:18.8 m s−1 PV3 PV2 PVU PV1/PV2 T2 PV1 PV1 PV2 9 Nov 7 Nov 6 Nov 8 Nov 10 Nov 12 Nov 11 Nov DT potential temperature (shaded, K), 925–850-hPa layer-averaged cyclonic relative vorticity (black contours every 0.5 × 10⁻⁴ s−1)
STC Sean (2011): Adapted Davis (2010) Calculation Location 1200 UTC 12 November 2011 925–300-hPa vertical wind shear:41.6 m s−1 PV3 T2 PV2 PVU PV1/PV2 PV1 PV1 PV2 9 Nov 7 Nov 6 Nov 8 Nov 10 Nov 12 Nov 11 Nov DT potential temperature (shaded, K), 925–850-hPa layer-averaged cyclonic relative vorticity (black contours every 0.5 × 10⁻⁴ s−1)
STC Climatology (1979–2010) • Apply adapted Davis (2010) methodology to North Atlantic tropical cyclogenesis cases identified in McTaggart-Cowan et al. (2013) • IBTrACS (v03r03) • North Atlantic cases1948–2010: 816 cases1979–2010: 460 cases (period of CFSR) • 36 h backward trajectories obtained using a reverse steering flow calculation (McTaggart-Cowan et al. 2008) and added to IBTrACS “A Global Climatology of Baroclinically Influenced Tropical Cyclogenesis”
STC Climatology (1979–2010) n = 460 Development pathways: (1) strong TT, (2) weak TT, (3) trough-induced, (4) nonbaroclinic, and (5) low-level baroclinic
STC Climatology (1979–2010) • The development pathway of a cyclone is determined by the “characteristics of the environmental state” 12 h prior to the cyclone’s first position in IBTrACS • Q metric (Q): the average convergence of the 400–200 hPa Q-vector (non-divergent) within 6° of the point of interest • Low-level thickness asymmetry (Th): the maximum 1000–700 hPa thickness values in two semi-circles within 10° of the point of interest
STC Climatology (1979–2010) • The development pathway of a cyclone is determined by the “characteristics of the environmental state” 12 h prior to the cyclone’s first position in IBTrACS • Q metric (Q): the average convergence of the 400–200 hPa Q-vector (non-divergent) within 6° of the point of interest • Low-level thickness asymmetry (Th): the maximum 1000–700 hPa thickness values in two semi-circles within 10° of the point of interest
STC Climatology (1979–2010) n = 460 Development pathways: (1) strong TT, (2) weak TT, (3) trough-induced, (4) nonbaroclinic, and (5) low-level baroclinic
STC Climatology (1979–2010) n = 222 Development pathways: (1) strong TT, (2) weak TT, (3) trough-induced,
STC Climatology (1979–2010) n = 621 Development pathways: (1) strong TT, (2) weak TT, (3) trough-induced,
STC Climatology (1979–2010) n = 124 Development pathways: (1) strong TT, (2) weak TT, (3) trough-induced,
STC Climatology (1979–2010) n = 361 Development pathways: (1) strong TT, (2) weak TT, (3) trough-induced,
STC Climatology (1979–2010) PV metric graphs, DT maps, and cross sections created for each cyclone
Future Work • Determine the time/position when individual cyclones became STCs using the three aforementioned PV metrics • Possible that not all baroclinic developments with upper-tropospheric features became STCs during their lifecycle • Identify features/trends in PV metrics that are associated with STCs • Develop objective identification techniques • Perform a cyclone-relative composite analysis for each of the aforementioned development pathways to document the structure, motion, and evolution of the upper-tropospheric features linked to STC formation
Future Work • Determine the time/position when individual cyclones became STCs using the three aforementioned PV metrics • Possible that not all baroclinic developments with upper-tropospheric features became STCs during their lifecycle • Identify features/trends in PV metrics that are associated with STCs • Develop objective identification techniques • Perform a cyclone-relative composite analysis for each of the aforementioned development pathways to document the structure, motion, and evolution of the upper-tropospheric features linked to STC formation
Future Work Identify features/trends in PV metrics that are associated with STCs PV1 iiiiiiPV2 iiiiiiPV3 iiiiiiPV1/PV2
Future Work Identify features/trends in PV metrics that are associated with STCs PV1 iiiiiiPV2 iiiiiiPV3 iiiiiiPV1/PV2
Future Work Identify features/trends in PV metrics that are associated with STCs Develop objective identification techniques PV1 iiiiiiPV2 iiiiiiPV3 iiiiiiPV1/PV2
Future Work Identify features/trends in PV metrics that are associated with STCs Develop objective identification techniques PV2 iiiiiiPV3 iiiiii Slope -2 -1 0 1 2
Future Work Identify features/trends in PV metrics that are associated with STCs Develop objective identification techniques PV2 iiiiiiPV3 iiiiiiPV3/PV2 iiiiii PV3/PV2 Ratio -2 -1 0 1 2
Future Work Identify features/trends in PV metrics that are associated with STCs Develop objective identification techniques PV2 iiiiiiPV3 iiiiiiPV3/PV2 PV3/PV2slope iiiiii PV3/PV2 Ratio -2 -1 0 1 2
Thoughts/Comments/Questions? Identify features/trends in PV metrics that are associated with STCs Develop objective identification techniques PV2 iiiiiiPV3 iiiiiiPV3/PV2 PV3/PV2slope iiiiii PV3/PV2 Ratio -2 -1 0 1 2