Download
1 / 10
100 likes | 221 Views
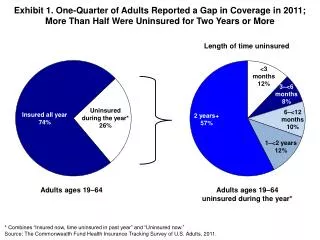
Uninsured Adults Age 19-64: Self-Employed, Part-Time & Full-Time. Gerard Russo, Ph.D. Sang-Hyop Lee, Ph.D. Lawrence Nitz, Ph.D. Abdul Jabbar, Ph.D. Candidate University of Hawai `i at M ānoa Hawai`i Coverage For All Project Technical Workshop V March 29, 2004.

E N D
Uninsured Adults Age 19-64: Self-Employed, Part-Time & Full-Time Gerard Russo, Ph.D. Sang-Hyop Lee, Ph.D. Lawrence Nitz, Ph.D. Abdul Jabbar, Ph.D. Candidate University of Hawai`i at Mānoa Hawai`i Coverage For All Project Technical Workshop V March 29, 2004 This research is funded in part through a U.S. Health Resources and Services Administration, State Planning Grant to the Hawaii State Department of Health, Prime Contract No. 1 P09 OA 00046-01. Sub-Contract Research Corporation of the University of Hawaii, Project No. 659075. Research conducted by the University of Hawaii, Social Science Research Institute in collaboration with the Hawaii State Department of Health, Hawaii Institute for Public Affairs/Hawaii Uninsured Project and the Hawaii Health Information Corporation.
Age Distribution of Hawaii’s Uninsured Population: CPS 1994-2003, 10-year Average 112,565 2,527 25,669 84,369 Preliminary results. Subject to revision.
Three Measures of Hours Worked: Current Population Survey • Usual hours worked per week last year at all jobs. • Hours worked last week at all jobs. • Hours worked last week at main job. Preliminary results. Subject to revision.
Uninsured Adults Age 19-64Hours Last Year All Jobs:CPS 1994-2003, 10-Year Average Preliminary results. Subject to revision.
Uninsured Adults Age 19-64Hours Last Week All Jobs:CPS 1994-2003,10-Year Average Preliminary results. Subject to revision.
Uninsured Adults Age 19-64Hours Last Week Main Job:CPS 1994-2003,10-Year Average Preliminary results. Subject to revision.
Distribution of Uninsured Adults Age 19-64 by Employment: CPS 1994-2003 Preliminary results. Subject to revision.
Distribution of Uninsured Employees Age 19-64 by Hours Worked Last Year Conditional on One Employer: CPS 1994-2003 Preliminary results. Subject to revision.
Distribution of Uninsured Employees Age 19-64 by Hours Worked Last Week at Main Job: CPS 1994-2003 Preliminary results. Subject to revision.
Uninsured Employees Age 19-64 by Major Industry:CPS 1994-200310-Year Average Preliminary results. Subject to revision.