Download
1 / 11
110 likes | 248 Views
Sofia Event Center 14-15 May 2014. Debugging, Profiling and Optimizing Web Apps with IE11 – F12 Developer Tools. Angel Todorov Principal Architect, Infragistics Inc. Contents. Using the DOM Explorer Using the Console Debugger Analyzing network activity Profiling – time & memory

E N D
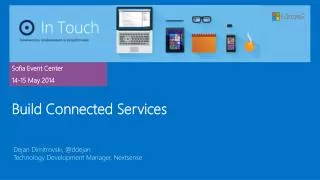
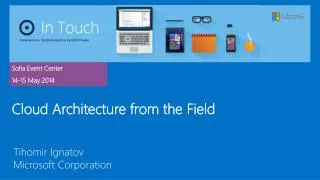
Sofia Event Center 14-15 May 2014 Debugging, Profiling and Optimizing Web Apps with IE11 – F12 Developer Tools Angel Todorov Principal Architect, Infragistics Inc.
Contents • Using the DOM Explorer • Using the Console • Debugger • Analyzing network activity • Profiling – time & memory • Using the UI Responsiveness Tool • Emulating geolocation / doc modes / orientations, etc. • Resources
Using the DOM Explorer • Intellisense & auto-completion • Drag & drop DOM nodes • The “Changes” & “Events” tabs • Pseudo-class toggle (Windows 8.1) – Hover & Visited
Using the Console • Execution targets (iframes) • Console Debugging API • Intellisenseautocompletion • Recording messages
Debugger • Just my Code • No refresh debugging • Pretty print • Source Maps (Windows 8.1) • Tracepoints • Breakpoints changes • Tabbed scripts
Analyzing Network Activity • Request timing • Network toolbar • Request/response details
Profiling – time & memory • Profiler overview • Precision profiling • Inclusive & Exclusive times • Memory tool (brand new) – overview • User marks • Taking and comparing heap snapshots • Detecting memory leaks
Using the UI Responsiveness Tool • Performance dashboard • The timeline view • Interpreting events (timeline details)
Emulation • Document Modes • Enterprise Mode (Windows 8.1) • Display Emulation • Geolocation emulation
Resources • What’s new in F12 Developer Tools: • http://msdn.microsoft.com/en-us/library/ie/bg182632(v=vs.85).aspx • Using the F12 Developer Tools: • http://msdn.microsoft.com/en-us/library/ie/bg182326(v=vs.85).aspx • MS BUILD 2014 - Internet Explorer 11’s Developer Tools, F12, Just Got Nicer (Again) • http://channel9.msdn.com/Events/Build/2014/3-580
Questions??? Share your feedback for this particular session and for the overall conference experience at http://aka.ms/intouch for a chance to win our prizes!